Download
1 / 78
780 likes | 788 Views
INTERNATIONAL BUSINESS. Ilan Bijaoui 2006 ibii@netvision.net.il. THE POLITICAL SPECTRUM. Rule people. Authoritarian Facist Communist Authoritarian. Reactionary Conservative Liberal Radical. Islam. Control souls. DEMOCRACY. TOTALITARISM. Economy+Politics.

E N D
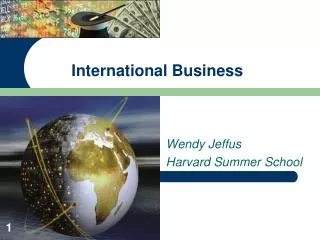
INTERNATIONAL BUSINESS Ilan Bijaoui 2006 ibii@netvision.net.il
THE POLITICAL SPECTRUM Rule people Authoritarian Facist Communist Authoritarian Reactionary Conservative Liberal Radical Islam Control souls DEMOCRACY TOTALITARISM Economy+Politics
COMPARATIVE MEASURES OF FREEDOM POLITICAL RIGHTS Fair elections, representatives with power, political parties, rights of minorities CIVIL RIGHTS Freedom of press, equality under law, social freedom, government-corruption
ECONOMIC SYSTEMS · Market Allocation: Consumers allocate resources. Competition + Consumer Protection (USA) · Command Allocation: State Planners. · Mixed Systems: Governmental Expenditures/GDP 32% USA, 64% Sweden
POLITICS AND MANAGEMENT DECISIONS • Political risks: Micro (population) and Macro (government) • Government intervention: Individual-communitarian paradigm
INDEX OF ECONOMIC FREEDOM Source: Heritage foundation www.heritage.org
Map of countries by GDP (PPP) per capita, based on the 2005IMF data.
Rank Country GDP$ per capita 1 Luxembourg 69,800 2 Norway 42,364 3 United States 41,399 4 Ireland 40,610 5 Iceland 35,586 6 Denmark 34,737 7 Canada 34,273 8 Austria 33,615 9 Hong Kong 33,411 10 Switzerland 32,571 11 Qatar 31,397 12 Belgium 31,244 13 Finland 31,208 • International Monetary Fund, World Economic Outlook Database, April 2006 [1] • [edit] • See also
14 Australia 30,897 15 Netherlands 30,862 16 Japan 30,615 17 Germany 30,579 18 United Kingdom 30,470 19 Sweden 29,898 20 France 29,316 21 Italy 28,760 22 Singapore 28,100 23 United Arab Emirates 27,957
24 27,572 Taiwan (R.O.C) 25 Spain 26,320 26 Brunei 24,826 27 New Zealand 24,769 28 Israel 23,416 29 Netherlands Antilles, Netherlands 22,750 30 Greece 22,392 31 Slovenia 21,911 32 Cyprus 21,232 33 South Korea 20,590
Leading exporters and importers in world merchandise trade,2005 (Billion dollars and percentage.)WTO
Sources: US International Trade Commission, US Department of Commerce
Source: PRC General Administration of Customs, China's Customs Statistics
Rank 49 Israel Country 35.5 11.7 6.4 1997 Giniindex Richest 10%to poorest 10% Richest 20%to poorest 20% Surveyyear 1 Denmark 24.7 8.1 4.3 1997 2 Japan 24.9 4.5 3.4 1993 3 Sweden 25 6.2 4 2000 4 Belgium 25 7.8 4.5 1996 5 Czech Republic 25.4 5.2 3.5 1996 6 Norway 25.8 6.1 3.9 2000 7 Slovakia 25.8 6.7 4 1996 8 Bosnia and Herzegovina 26.2 5.4 3.8 2001 9 Uzbekistan 26.8 6.1 4 2000 10 Finland 26.9 5.6 3.8 2000
MOTIVATION PUSHES AND PULLS TO INTERNATIONALIZE TRADITIONAL MOTIVATIONS(Bartlett) · Expand sales, acquire resources, minimize risk . Secure Key Supplies · Access Low Cost Factors · Local Market Saturation-Competition · Market Seeking Behavior · Technology – Vernon Product Life Cycle
EMERGING MOTIVATIONS · Economic, Technological, Social Developments · Amortization of R&D Expenditures(public telephone switching systems) · Shortening Product Life Cycle · Scanning & Learning Capabilities · Competitive Positioning (Cross Subsidization)
NATURAL ENVIRONMENT Raw materials Energy costs Pollution Geography Know how Change Infrastructure TECHNOLOGICAL ENVIRONMENT Improvement Regulation PM 4.4 Natural and technological environments
DEMOGRAPHIC ENVIRONMENT Age Family Population Education ECONOMIC ENVIRONMENT Spending patterns Economic PM 4.3 Demographic and economic environments
POLITICAL ENVIRONMENT Interest groups Legislation Enforcement CULTURAL ENVIRONMENT Values Subcultures Shifts PM 4.5 Political and cultural environments