Download
1 / 14
150 likes | 161 Views
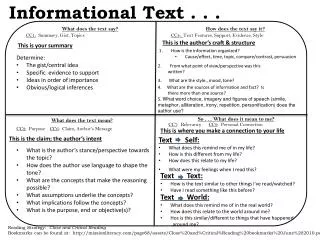
Special Features of Informational Text. “A picture is worth a thousand words.”. “A Picture is Worth a Thousand Words”. In some cases, visual images are the best way to get information across clearly to the reader.

E N D
Special Features of Informational Text “A picture is worth a thousand words.”
“A Picture is Worth a Thousand Words” • In some cases, visual images are the best way to get information across clearly to the reader. • You can show in onepicture what it might take pages of writing to explain.
Types of Special Features • There are many ways to put information into visual form. These include: • Graphs • Diagrams • Tables
Graphs • A graph puts numbers into a form that is easy to see. • Different graphs are used for different purposes. • Types of graphs include: • Circle graphs or pie charts • Line graphs • Bar graphs
Circle Graph • Circle graphs are also called pie charts because they are cut up into slices like a pie. • They are used to show how different parts of a group compare to each other and how each part compares to the whole group. • Each slice is labeled with the name of the group or item it represents.
Line Graphs • A line graph is used to show how something changes over time. • What is changing and the span of time are called the variables. • A change in one variable is measured on the vertical, or up-and-down axis. • A change in another variable is shown on the horizontal axis, or left-to-right axis.
Bar Graphs • A bar graph also uses vertical and horizontal axes to display information. • A bar graph uses thick bars to compare amounts.
Pictures That Inform • Pictures can also be used to give information. • These types of informational pictures include: • Diagrams- pictures with labeled parts • Maps- tiny pictures of large areas • Illustrations- images of the subject of the passage
Tables • Tables put information in an easy-to-read form, usually in rows and columns. • Tables allow you to see how numbers compare to each other.