Download
1 / 32
320 likes | 511 Views
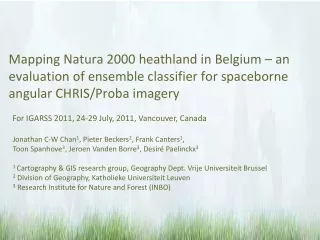
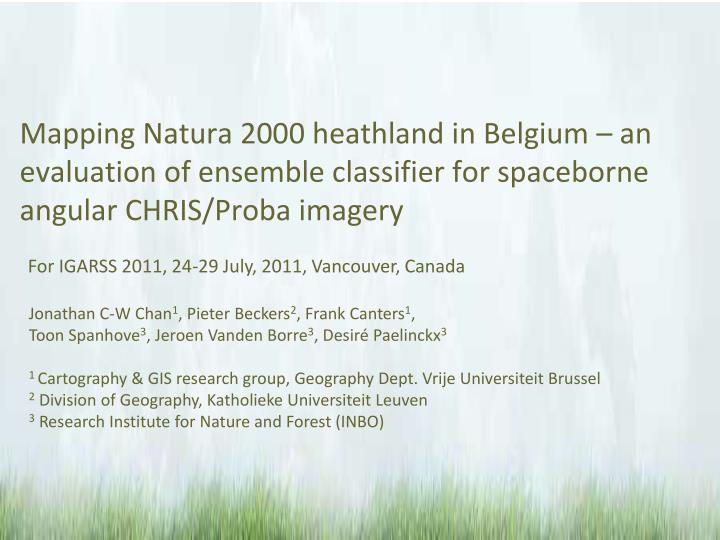
Mapping Natura 2000 heathland in Belgium – an evaluation of ensemble classifier for spaceborne angular CHRIS/Proba imagery. For IGARSS 2011, 24-29 July, 2011, Vancouver, Canada. Jonathan C-W Chan 1 , Pieter Beckers 2 , Frank Canters 1 ,

E N D
Mapping Natura 2000 heathland in Belgium – an evaluation of ensemble classifier for spaceborne angular CHRIS/Proba imagery For IGARSS 2011, 24-29 July, 2011, Vancouver, Canada Jonathan C-W Chan1, Pieter Beckers2, Frank Canters1, Toon Spanhove3, Jeroen Vanden Borre3, Desiré Paelinckx3 1 Cartography & GIS research group, Geography Dept. Vrije Universiteit Brussel 2 Division of Geography, Katholieke Universiteit Leuven 3 Research Institute for Nature and Forest (INBO)
WP5000 Exploitation WP6000 Dissemination WP2000 Analysis WP3000 Data Collection WP4000 Data Processing WP5100 Structural Analysis WP6100 Reporting WP2100 Literature Study WP3100 Field Work WP4100 Spatial contextual description WP5200 Validation WP6200 Publications WP2200 Requirement Analysis WP3200 Data labeling WP4200 Data Modeling WP3300 RS Data Acquisition WP5300 Operational Integration WP4300 SR Image reconstruction WP4400 Ensemble Classifications VITO UA VUB ALTERRA INBO ALL HABItat STATus reporting with remote sensing methods (HABISTAT) 2007-2011
OUTLINE Background of NATURA 2000 habitats Remote sensing methodology for monitoring Results Conclusions
The Habitats Directive (92/43/EEC) • Adopted in 1992 together with the Bird’s Directive, is the cornerstone of Europe’s nature conservation policy • Two pillars: the Natura 2000 network of protected sites and strict system of species protection • It protects over 1,000 animals and plant species and over 200 so called “habitat types” (e.g. Special types of forests, meadows, wetlands, etc.), which are of European importance. • Main obligations for European member states • survey the conservation status of targeted habitats/species and report to EU every SIX years (actual area, range, quality, and future prospect) • take measures to bring/maintain targeted habitats and species in ‘favourable conservation status’ (i.e. long-term maintenance assured) Source: Council Directive 92/43/EEC of 21 May 1992 on the conservation of natural habitats and of wild fauna and flora (1992)
Heathland in Kalmthout (a) Favourable condition (b) Unfavourable condition Figure 1. “Dry sand heaths with Calluna and Genista” (2310) is a Natura 2000 habitat commonly found in the study area. In favourable conditions, it consists of a mixture of dwarf scrub, open sand and patches of pioneer grasses and mosses (a); but as a result of eutrophication, encroachment with purple moor grass (Molinia caerulea) leads to a monotonous vegetation (b), with a heavily reduced ecological value.
METHODOLOGY Data - Investigate angular hyperspectral CHRIS Classifier - Testing tree-based ensemble classifiers using support vector machines (SVM) as a benchmark comparison Accuracy assessment - ten independent runs with random re-sampling
Interesting features of CHRIS/Proba & its link with future sensor • Spaceborne CHRIS/Proba imagery • - 18-62 bands between 0.4-1 μm • - 17-34m spatial resolution • multi-angle acquisition at nadir, ±36°, and ±55° • Future Sensor – EnMAP 2015 • Operated by German Space Agency (DLR) • Specs: 30m resolution (0.4-2.5 μm) • Angular viewing: +/- 30° off-nadir -55° +55° -36° 0° +36° 18 SEP 2007 – Acquisition mode 3, 18 bands, 17m pixel size
Natura 2000 habitats evaluation spreadsheet of dry sand heath (2310)
An adapted classification scheme for spaceborne images – 10 classes
Geostatistical sampling method Initial field driven 2007 Random stratified 2009 A total of 586 sampling points were gathered
Classification algorithms Why ensemble classifiers and why tree-based Random Forest and Adaboost? • accurate • fast • easy to use (minimum parameter tuning) • high interpretability (not a black box) • easy to understand • machine learning algorithms with extremely high repeatability • robust with high dimensional input (well tested with hyperspectral data inputs) • no assumptions on data distribution • robust with noisy (absence of) data • It is free!
RANDOM FOREST Tuning parameters Number of trees Number of input features used for each tree, randomly drawn from all the input features Two sequences 24 different numbers of trees, ranging from 1 to 700 10 different numbers for the amount of input features used for each tree, ranging from 1 to 10 Look at testing data and compare overall accuracies
ADABOOST.M1 Multiclass AdaBoost using classification trees Two parameters Number of iterations Maximum depth of any node of the final tree Sequence of iterations Comparing different numbers of iterations, ranging from 5 to 100 Looking at differences when changing the maximum depth
SUPPORT VECTOR MACHINES Most time-consuming for tuning First comparing the different kernel functions Using a radial basis function kernel and a ‘grid-search’ Searching the optimal values for the two parameters (gamma and cost) Coarse grid Fine grid Even finer grid
MAPPING RESULTS SVM – 3 images SVM - nadir
Only Nadir image Adaboost Random Forest
3 angular images Adaboost Random Forest
RESULTS BY TRIAL: 3 angular imagesSupport Vector Machines L H
CONCLUSIONS Angular images increased overall accuracy and provide a classification with less salt and pepper effects. Support vector machines has the highest accuracies, but does not improve much with more features. Random Forest has the highest mean class accuracies Parameter tunings with RF and Adaboost quite fast, comparatively easier. Big variations in accuracy between trials; more trials may provide a better characterization of algorithm behaviour. General classification rates for Calluna (38-45%) or Erica (37-58%) -dominated heathland are low. A better accuracy (69-80%) is observed in Molinia-dominated heaths. Future sensors covering full 0.4-2.5 μm range could increase accuracy.