Download
1 / 20
210 likes | 367 Views
In deterministic analysis, single fixed values (typically, mean values) of representative samples or strength parameters or slope parameters are used in the analysis.

E N D
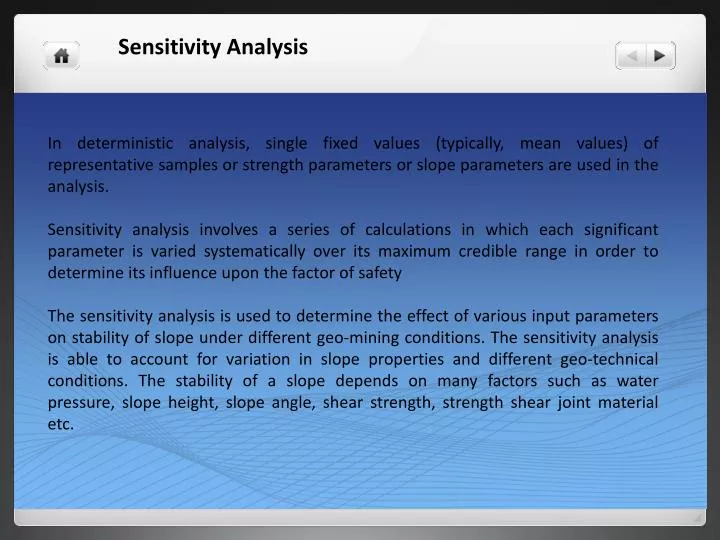
In deterministic analysis, single fixed values (typically, mean values) of representative samples or strength parameters or slope parameters are used in the analysis. Sensitivity analysis involves a series of calculations in which each significant parameter is varied systematically over its maximum credible range in order to determine its influence upon the factor of safety The sensitivity analysis is used to determine the effect of various input parameters on stability of slope under different geo-mining conditions. The sensitivity analysis is able to account for variation in slope properties and different geo-technical conditions. The stability of a slope depends on many factors such as water pressure, slope height, slope angle, shear strength, strength shear joint material etc. Sensitivity Analysis
In sensitivity analysis a common approach is that of changing one-factor-at-a-time (OAT), to see what effect this produces on the output. This appears a logical approach as any change observed in the output will unambiguously be due to the single factor changed. Furthermore by changing one factor at a time one can keep all other factors fixed to their central or baseline value. This increases the comparability of the results (all ‘effects’ are computed with reference to the same central point in space) and minimizes the chances of computer program crashes, more likely when several input factors are changed simultaneously
Sensitivity is expressed by a dimensionless index I, which is calculated as the ratio between the relative change of model output and the relative change of a parameter.The sensitivity index (I) as defined by Lenhart (2002) is expressed in equation given below.
Schematic of the relation between an output variable y and a parameter x.
Probabilistic analysis in slope stability involves quantity the task of quantitatively the source uncertainty. A probabilistic analysis is based on a correct randomness determination of the parameters affected by uncertainties. Therefore, the probability density function of each of the random variable is demined which governs the stability problem. • The variable associated with slope design are uncertain due to many reasons. Therefore, to account for uncertainty the probabilistic method can be used for assessing the stability of slope. These are many source of uncertainty in slope stability analysis. The amount of uncertainty varies from one analysis to another and from one site to another. These uncertainties are • Site topography • Site straitegraphy and variability • Geologic origins and characteristics of subsurface materials • Groundwater level. • In- situ soil and /or rock characteristics • Engineering propertics • Soil & rock behavior Probability density function
Probability density function (PDF) of a continuous random variable is a function that describes the relative likelihood for this random variable to occur at a given point. Probability density function
• Beta distributions are very versatile distributions which can be used to replace almost any of the common distributions and which do not suffer from the extreme value problems discussed above because the domain (range) is bounded by specified values. • Exponential distributions are sometimes used to define events such as the occurrence of earthquakes or rockbursts or quantities such as the length of joints in a rock mass. • Lognormal distributions are useful when considering processes such as the crushing of aggregates in which the final particle size results from a number of collisions of particles of many sizes moving in different directions with different velocities. • Weibul distributions are used to represent the lifetime of devices in reliability studies or the outcome of tests such as point load tests on rock core in which a few very high values may occur Probability density function
Probabilistic Slope Stability Analysis Methods General Monte Carlo Simulation Approach
It uses random or pseudo-random numbers to sample from probability distributions. The large numbers of samples are generated and used to calculate factor of safety. • The input parameters for a Monte Carlo simulation fall into two categories, the deterministic parameters used for a conventional analysis and the parameters which define the distribution of the input variables. For slope stability analysis the deterministic parameters are: • Critical Height (H) or Factor of Safety (FS) • Slope Angle from the Horizontal Plane (β) • Angle of Friction (φ) • Cohesion (c) • Unit Weight (γ) • Saturated Unit Weight (γ Sat) • Submerged Unit Weight (γ ′) Monte Carlo method
The Monto Carlo simulation follows a four step process: For each component random variable being considered, select a random value that conforms to the assigned distribution. Calculated the value of the FOS using the adopted performance function and the output values obtained from step1. Repeat steps 1 and 2 many times, storing the FOS result from each must calculation. Use the many calculated FOS values from the Monto Carlo simulation to some timate (a) the probability, (b) the sample mean and variance, and (c) the FOS PDF from the histogram.
Point Estimate Method It is an approximate numerical integration approach to probability modeling. The Generalised Point Estimate Method, can be used for rapid calculation of the mean and standard deviation of a quantity such as a factor of safety which depends upon random behaviour of input variables. To calculate a quantity such as a factor of safety, two point estimates are made at one standard deviation on either side of the mean (μ ±σ ) from each distribution representing a random variable. The factor of safety is calculated for every possible combination of point estimates, producing 2n solutions where n is the number of random variables involved. The mean and the standard deviation of the factor of safety are then calculated from these 2n solutions
The reliability of a slope (R) is an alternative measure of stability that considers explicitly the uncertainties involved in stability analyses. The reliability of a slope is the computed probability that a slope will not fail and is 1.0 minus the probability of failure: • R=1-Pf Reliability Analysis
Two common methods of calculating the coefficient of reliability are • Margin of safety method • Monte Carlo method Reliability Analysis
If the resisting and displacing forces are mathematically defined probability distributions and respectively it is possible to calculate a third probability distribution for the margin of safety. If the lower limit of the resisting force distribution fD(r) is less than the upper limit of the displacing force distribution fD(d). Margin of safety method
Monte Carlo analysis The examined problem variables are generated by these random numbers in such a way as to respect the assumed probability distribution curves. 1 Estimate probability distributions for each of the variable input parameters. 2 Generate random values for each parameter; between 0 and 1 and the corresponding value of the parameter. 3 Calculate values for the displacing and resisting forces and determine if the resisting force is greater than the displacing force. • Repeat the process N times (N > 100) and then determine probability of failure Pf from the ratio • where M is the number of times the resisting force exceeded the displacing force (i.e. the factor of safety is greater than 1.0).