Download
1 / 31
310 likes | 473 Views
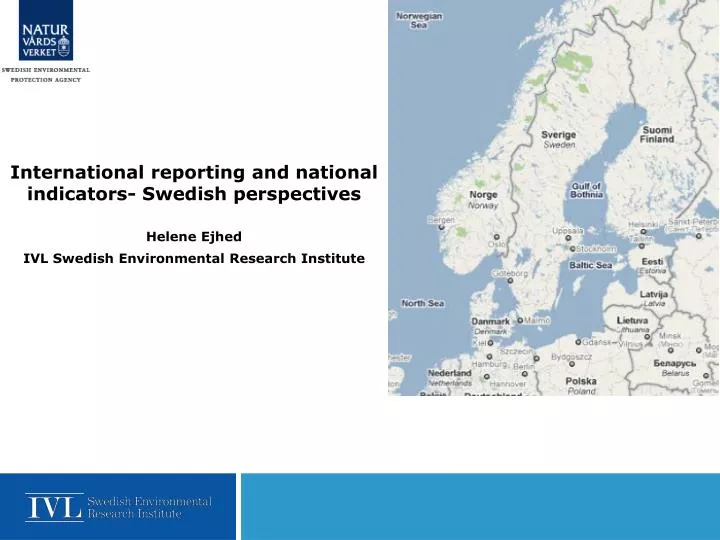
International reporting and national indicators- Swedish perspectives. Helene Ejhed IVL Swedish Environmental Research Institute. International reporting. Water Framework Directive. Source apportionment and load on the sea. HELCOM PLC Periodical. EEA WISE SoE Emissions. + water use,

E N D
International reporting and national indicators- Swedish perspectives Helene Ejhed IVL Swedish Environmental Research Institute
International reporting Water Framework Directive Source apportionment and load on the sea HELCOM PLC Periodical EEA WISE SoE Emissions + water use, availability OECD/Eurostat Inland waters Direct point sources and river mouth load OSPAR RID HELCOM PLC Annual Wastewater directive EEA TCM E-PRTR
Most comprehensive reports • HELCOM PLC Periodical –objectives 1. to compile information on the water-borne inputs via rivers and direct discharges of important pollutants entering the Baltic Sea from different sources in the Baltic Sea catchmentarea on the basis of harmonised monitoring methods; 2. to follow up the long-term changes in the pollution load from various sources; 3. to determine the priority order of different sources of pollutants for the pollution of the Baltic Sea; 4. to assess overall the effectiveness of measures taken to reduce the pollution load in the Baltic Sea catchment area; and 5. to provide information for assessment of the state and long-term changes of the marine environment in the open sea and the coastal zones. HELCOM = Baltic sea including Kattegatt
HELCOM PLC periodical - variables • - Every 6 years • - Ntot and P tot • - Diffuse sources • Natural background • Retention • (removal processes in • lakes and rivers) • Resolution: water basins
WFD pressure analysis -purpose • a review of the impact of human activity on the status of surface waters and groundwater • to take measures to protect water bodies in order to achieve ”good ecological and chemical status” • Includes: • · point sources of pollution, • · diffuse sources of pollution, • · effects of modifying the flow regime through abstraction or regulation, and morphological alterations. • Priority substances, nutrients and hazardous • Risk assessments Present cycle 2009-2015 Good Average
EEA WISE SoE Emissions • Reporting process are primarily used to compile indicator factsheets, associated with the EEA's Core Set Indicators, upon which EEA assessment reports are based. • Every three years full reporting • Includes: • Diffuse and point sources • Resolution water districts • Hazardous substances and nutrients, >120 substances • Focus in Sweden so far : Nutrients and metals
Most pronounced water issues in Sweden • Eutrophication • Acidification • Metal load • Hazardous organic substances load Loss in biodiversity and human health issues
Source apportionment and load on the Sea - nutrients and metals in SWEDEN - national env. target assessments- international reporting HELCOM, WFD and EEA WISE The challenge • Sparse number of monitoring data –specifically on metals • Geographically distributed • National scale with relatively high resolution • Possibly unknown diffuse sources WFD=EU Water framework directive EEA=European Environment Agency
Recirkulation and Retention in lakes, rivers and soils % Source apportionment and load on the sea – The concept Arable, Forest, Urban, Wetland, Alpine, Other Area, km2 Leaching conc, mg/l Runoff l/s,km2 Landuse load, kg Lakes Area, km2 Deposition load, kg kg/km2, s Atmospheric deposition • Point source • load kg • MWWTP, • Industry, • SWTS
Dynamic model for arable land leakage conc. of N and P, runoff and retention of N and P • SOILNDB for N • ICECREAMDB for P • HBV-NP for retention
Leaching concentrations from landuse- forest, other open, alpine, wetland and arable • The number of sites too few to separate between all landuse classes • Other open include alpine, and wetland in the results • Very few sites in some ecoregions • 0 sites in ecoregion 1 same conc. as ecoregion 2 • 13 sites in ecoregion 3 and 4 Except for Hg ! Hg – TOC correlation used to increase number of sites Hg = 0,284 * (TOC) + 0,275 (r2 = 0,589; p < 0,0001) • 7 Ecoregions • Climate • Soils • Hydrology • Altitude • -5 Water districts
The concept – catchments • 13000 subcatchments setup • landuse • 1000 runoff catchments • concept resolution • 119 water basins • 45 monitored river mouths • 5 water districts
Urban area 1% Forest 60% Arable land 7%, Other open 4% Alpine area 8%, Lake area 8 % Wetland 7%, Landuse • The total surface of Sweden is about 480 000 km2 • Forest 60% of the surface • Lakes 8 % of the surface • Urban 1 % • GSD 1:250000, Subsidies system “Block data” for arable land, Urban subclasses of Corinne resolution • About 17000 waterbodies, • lakes > 1 km2 area • rivers > 15 km long
Runoff – HBV modelling • About 500 monitoring stations available • Split-site calibration and validation series Source: Brandt, Ejhed, Rapp Swedish EPA report 5995
HBV results Runoff Flow (m3/s) Söderköpingsån Flow (m3/s) Runoff Long-term average 1985-2004 l/s/km2 Skivarpsån Flow (m3/s) Source: Brandt, Ejhed, Rapp Swedish EPA report 5995
Deposition of metals • Only 2 monitoring stations available – latest available three year average • Over 500 moss monitoring sites – collective sample • Ordinary Kriging interpolation • 75% sites for prediction and 25% sites for validation • Rainfall yearly average • Deposition per catchment • bi-linear interpolation of pixels in the center
Deposition • South-north gradient • East- west gradient • Hg, Pb and Ni long-range transported • Pb deposition has decreased substantially
Point sources • MWWTP- Municipal wastewater treatment Plants • Industry • Historical and present mining • Iron and steel • Paper and pulp • Waste sites • All registered industrial load • SDWS- small domestic waste-water treatment systems • almost 700 000 SDWS • Population • treatment techniques • treatment efficiencies
Yield – Cu and Cd • The yield similar to the pattern of high runoff • Northern coastal high deposition, high leakage conc. and point sources noteworthy • Southwest high yield due to high deposition and high runoff
Ni Load source apportionment • 80 % for Zn, Cd, Cu and Hg are diffuse sources • > 90 % for Pb and Ni are diffuse sources • Forest - largest contribution • Deposition and stormwater important contributions Hg Pb Cd
Retention for N and PCalibration of soil retention, arable land av markretention i små jordbruksområdenSkivarpsån, Skåne (102 km2), läckageregion 11. Markretention påverkar oorg-N och tot-N Q m3/s Tot-N mg/l Inorg-N mg/l gross conc net conc monitoring data Org-N mg/l
N retention to the Sea Gäller enbart för jordbruksläckage och enskilda avlopp
Resultat - Diffus belastning kväve • Brutto 134700 ton, netto 97900 ton • Diffus nettobelastning = 81 % av total netto • Jordbruksmark = ca 30 % av total netto • Skogsmark inkl. hygge > 30 % av total netto • Högst belastning i sydvästra Sverige • Hög avrinning och stor jordbruksbelastning.
Sorces anthropogenic net N Eg. BSAP=N minska 20800 ton, i Egentliga Östersjön framförallt
National Environmental Objectives • 16 environmental objectives of which 5 are directly targeted at the water environment quality, water supply and biodiversity • The environmental quality objectives describe what quality and state of the environment are sustainable in the long term.
Zero Eutrophication • Interim target • P anthropogenic emissions to inland waters and coast should decrease by 20 % from 1995 to 2010 • N anthropogenic emissions from southern Sweden to the Sea should decrease by 30 % from 1995 to 2010 • Will be evaluated this year, but so far
National Environmental ObjectivesGood-quality groundwater • Groundwater quality will not be adversely affected by human activities such as land use, extraction of natural gravel, releases of pollutants etc. • The quality of discharging groundwater will be such as to contribute to viable habitats for plants and animals in lakes and watercourses. • Consumption and other human influences will not lower levels of groundwater in such a way as to jeopardize its availability and quality. • Groundwater will have such low levels of pollutants resulting from human activities that its quality will meet the criteria for good drinking water quality under Swedish drinking water standards and for good groundwater status under the EU Water Framework Directive (2000/60/EC).
National Environmental ObjectivesGood-quality groundwater • Will the objective be achieved? • The Environmental Objectives Council’s assessment is that the objective Good-Quality Groundwater can be achieved by 2020 if further action is taken. No clear trend in the state of the environment can be seen.
National Environmental ObjectivesFlourishing lakes and streams Interim target Water supply plans By 2009 water supply plans, including water protection areas and protection regulations, will have been adopted for all public and large private surface water sources. Large surface water sources are defined as surface waters: serving > 50 persons or providing > 10 m3 a day as an average. For example: • Nutrient and pollutant loadings will not adversely affect the basic conditions for biodiversity. • Alien species and genetically modified organisms that could threaten biodiversity will not be introduced. • The valuable assets which lakes, shores and watercourses represent in terms of experience of nature and cultural heritage, as well as bathing and outdoor recreation, will be safeguarded and developed prudently and sustainably.
National Environmental ObjectivesFlourishing lakes and streams –water supply Will the interim target be achieved? • This target was not met by 2009. Efforts to draw up water supply plans are under way in some counties. According to information from the Geological Survey of Sweden (SGU), in October 2009 only 41 per cent of all municipal surface water sources were protected. • The river basin district authorities’ programmes of measures, adopted in December 2009, will speed progress towards the target.
Conclusions • Many international data deliveries on similar but not the same data – recommendation on harmonisation • Study the most comprehensive reports to assess status • recommendation to reuse data instead of adding reports • include a short version for countries not reporting WFD for example