Download
1 / 12
120 likes | 224 Views
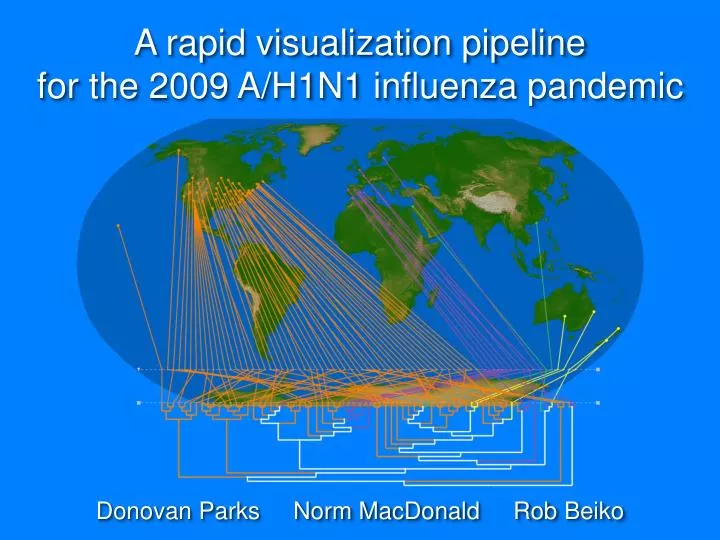
A rapid visualization pipeline for the 2009 A/H1N1 influenza pandemic. Donovan Parks Norm MacDonald Rob Beiko. Outline. A little biology Motivation Data acquisition pipeline GenGIS : a genomic GIS framework Examples. Photo obtained from commons.wikimedia.org. 1/10. H1N1 Biology.

E N D
A rapid visualization pipeline for the 2009 A/H1N1 influenza pandemic Donovan Parks Norm MacDonald Rob Beiko
Outline • A little biology • Motivation • Data acquisition pipeline • GenGIS: a genomic GIS framework • Examples Photo obtained from commons.wikimedia.org 1/10
H1N1 Biology Modified photo from commons.wikimedia.org 2/10
Motivation • Move from reactive to preventive health strategy • Increased sampling requires automated tools 3/10
Pipeline Overview 4/10
SeqMonitor http://ratite.cs.dal.ca/SeqMonitor/ 6/10
NA Polymorphism October 19, 2009 9/10
Conclusions • Global, continuous sequencing of infectious diseases would allows us to implement preventive health strategies. • Automated tools will be necessary to provide analyses to inform such policies. 10/10
Further Information • SeqMonitor: http://ratite.cs.dal.ca/SeqMonitor • MacDonald, N. J., Parks, D. H., and Beiko, R. G. SeqMonitor: Influenza Analysis Pipeline and Visualization. PLoS Currents: Influenza. 23 September 2009: RRN1040. • GenGIS: http://kiwi.cs.dal.ca/GenGIS • Parks, D. H., Porter, M., Churcher, S., Wang, S., Blouin, C., Whalley, J., Brooks, S., and Beiko, R. G. GenGIS: A geospatial information system for genomic data. Genome Res. July 27, 2009. • Parks, D. H., MacDonald, N. J., and Beiko, R. G. Tracking the evolution and geographic spread of influenza A. PLoS Currents: Influenza. 21 August 2009: RRN1014.