Download
1 / 19
190 likes | 334 Views
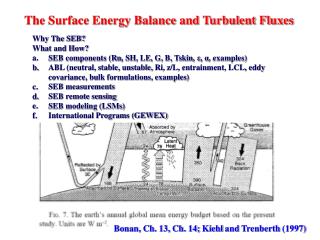
Analysis of PBL Turbulent and Non-turbulent Fluxes. M. Hicks 1 , S. Kang 2 , B. Demoz 1 , E. Joseph 1 , 1 Howard University, Washington, DC, USA 2 UCAR, Boulder, CO, USA. Outline. Overview HUBC Characteristics Methodology Preliminary Results Future Work. Motivation.

E N D
Analysis of PBL Turbulent and Non-turbulent Fluxes M. Hicks1, S. Kang2, B. Demoz1, E. Joseph1, 1Howard University, Washington, DC, USA 2 UCAR, Boulder, CO, USA
Outline • Overview • HUBC Characteristics • Methodology • Preliminary Results • Future Work
Motivation • Previous (observational and model) studies have suggested that strong heterogeneous CBLs can produce non-turbulent fluxes at scales with magnitudes comparable to turbulent fluxes (Kang and Davis 2008, Kang et al. 2007, LeMone et al. 2002, Mahrt et al. 1994a,b) • Implying turbulent theory may fail under these conditions From (Kang, 2008)
Objective & Purpose • Objective • Examine the importance of non-turbulent to turbulent heat and moisture transport in a heterogeneous CBL. • Look at the importance of presenting a proper timescale • Purpose • Analyze the non-turbulent and turbulent characteristics of fluxes at HUBC through tower observation • No one has used tower observations to examine non-turbulent flux exchanges
Howard University Beltsville, MD Research Campushttp://meiyu.atmphys.howard.edu/beltsville/inde3.html • Site Characteristics • Located 12 miles NE of Washington,DC • Heterogeneous landscape • Experiences a wide range of water vapor and aerosol concentrations HU Beltsville Campus
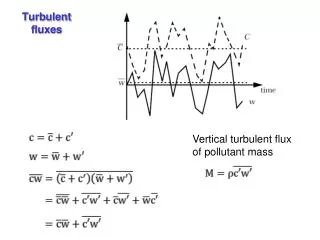
Methodology • Apply FFT and MR Spectra analysis to find timescale, , needed to separate turbulent and non-turbulent fluxes • The traditional 30 minute may not be sufficient in eliminating non-turbulent fluxes for heterogeneous cases. (Vickers and Mahrt 2003) • Examine the contribution of non-turbulent fluxes to total flux XTot=X-<X>, XNT=[X]-<X>, XT=X-[X]
Preliminary Results • Vertical velocity energy pass 100 sec is small as expected • WVMR has strong energy exchanges around 1000 sec • A timescale less much less than 30mins is needed to separate T and NT fluxes • The NT fluxes are not very strong
Separating Fluxes • Green~ Instantaneous timeseries • red ~mesoscale averaged timeseries, [X] • blue ~domain averaged timeseries,<X> X’=X-<X> XNT=[X]-<X>, XT=X-[X]
Preliminary Results The lack of intensity from pure non-turbulent mesoscale flux is seen The intensity of WT transport of non-turbulent heat is clearly seen
Summary • We showed that a 30 minute timescale average may not always represent pure turbulence. • It is believed that including non-turbulence can give a bias to CBL parameterizations • Interscale flux maybe able to explain intense moments of non-turbulence
Future Work • Make Further progress with analysis surface layer CBL turbulent and non-turbulent fluxes • Expand diagnosis to examine flux characteristics of the well mixed and inversion layers of the heterogeneous CBL. • Summer 2010 HUBC Field Campaign • Tethersonde Balloon • HURL ~1min • MDE wind profiler ~1min • Microwave Radiometer (r,T) ~2min • Leosphere lidar ~10s • Radiosondes
Acknowledgements • I thank all supporters of this work, • Dr. Songlak Kang for suggestions • Dr. Belay Demoz • Dr. Everette Joseph • Dr. Demetrius Venable and HURL team • NCAS for support
Overview • Why Study PBL Fluxes??? • Fluxes play a critical role in the development of the height of the PBL • Operational obs of PBL heights are not taken to validate forecast model parameterizations • Models at time can significantly over or under estimate PBL heights
Monin-Obukov Similarity theory Businger et al. 1971
Kang and Davis 2008 Interscale flux Turbulent flux Non-Turbulent flux Weak heterogeneous case Strong heterogeneous case
Preliminary Results 07092007 F(sec-1) F(sec-1) • Green line is instantaneous timeseries, X • red line is mesoscale averaged timeseries, [X] • blue line is domain averaged timeseries,<X> XNT=[X]-<X>, XT=X-[X]