Download
1 / 17
170 likes | 302 Views
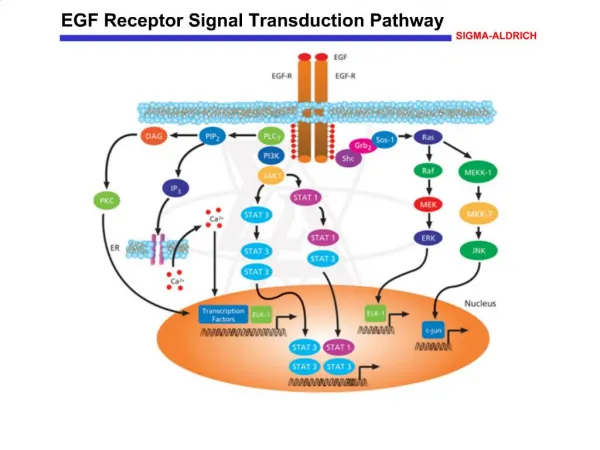
Receptor clustering and signal processing in E.coli Chemotaxis. Ref.1----TRENDS in Microbiology Vol.12 No.12 December 2004. Ref.2----PNAS Vol. 102 No. 48 November 2005 . Higher Methylation level. Binding Attractant. Decrease. Increase. CheA Activity. Lower Methylation level.

E N D
Receptor clustering and signal processing in E.coli Chemotaxis Ref.1----TRENDS in Microbiology Vol.12 No.12 December 2004 Ref.2----PNAS Vol. 102 No. 48 November 2005
Higher Methylation level Binding Attractant Decrease Increase CheA Activity Lower Methylation level Binding Repellent Increase Decrease
short re-orientations (or tumbles) smooth swimming (or runs) counterclockwise (CCW) clockwise (CW)
Three interesting points: 1. The high sensitivity 2. Wide dynamic range 3. Integration of multiple stimuli of this pathway Cooperative Protein Interactions in Receptor Clusters Computer Modeling Quantitative Experimental Analysis
Model of the higher-order structure of a receptor cluster. (a,b) Receptor homodimers (Tsr, black; Tar, gray; Trg, yellow) are thought to form trimers that, in the absence of CheA and CheW, appear as loose caps at cell poles. CheA and CheW assemble into signalling complexes with trimers to form tight receptor clusters at the pole through a combination of receptor–receptor, receptor–CheW, receptor–CheA, CheA–CheW, and possibly CheW–CheW interactions. (c,d) In fluorescence images, receptor localization is visualized with fluorescently-tagged CheR.
The high sensitivity and wide dynamic range As little as 10nM aspartate Less than 10 molecules of aspartate in a volume of an E. coli cell Moreover, at least for some attractants, cells retain high sensitivity over variations of five orders of magnitude of ambient attractant concentrations. Estimated to change the receptor occupancy by 0.2% Resulted in a 23% change in the BIAS of motor rotation, indicating signal AMPLIFICATION (or gain) by a factor of ~100
Kinds of Models Two-state model Assumption 1:The receptor exists in two conformational states, active or inactive, which either promote or inhibit the activity of associated CheA Assumption 2:The receptor–kinase complex is stable on the timescale of the chemotactic response and kinase associated with active receptor is always active and vice versa. Assumption 3: A cluster consists of independent receptor–kinase complexes and changes in their activity directly reflect changes in receptor occupancy. It is thus unable to explain signal amplification.
Allosteric models of multi-subunit receptor–kinase complexes Assumption 1(Key):The inactive state of a receptor homodimer has a higher affinity to attractant than the active state. Assumption 2: The inactive state can be stabilized by either attractant binding or the conformational states of neighbouring receptors.
Some properties: 1.The sensitivity of the response therefore grows dramatically with increasing numbers of subunits. 2. A complex of interacting receptors thus has a tendency to exhibit a switch-like behaviour. If activity of such a complex (or its subunits) in absence of ligand is moderate, binding of attractants to only a few receptors stabilizes the entire complex in the inactive state. By contrast, if the initial bias toward the active state is high, the complex does not make the transition to the inactive state until most subunits are occupied, producing a steep response with a large Hill coefficient. 3. In a mixed allosteric receptor complex, addition of aspartate increases the sensitivity to serine, and vice versa .
The bias of the complex to an active state is moderate Derived from the model Tune and keep High sensitivity in wide dynamic range Feedback through the methylation system in wild-type cells Role of Methylation System To sence Cause Change of the ligand concentration
Things to be done? Experimentally, the physical nature of these interactions remaims obscure. Nor is it clear how receptor clusters localize to the cell poles and whether localization of signalling proteins in bacteria is a general feature or a special feature of chemotaxis. On the modelling side, allosteric models of receptor interactions in the receptor–kinase complex, when combined with kinetic models of the cytoplasmic part of the pathway, are able to account for most observations in chemotaxis, but they still have to be ‘tuned’ to match experimental data more closely. Especially, how does the methylation level affect the parameters in the model.
MWC model by using an Hamiltonian approach The complex is made of N identical subunits, each of which can bind to a ligand molecule. The ligand occupancy of the ith subunit is given by σi, σi=0, 1 for vacant and occupied receptor, respectively (i=1, 2, . . . , N). In the all-or-none MWC model, the activity s of the complex is either active (s=1) or inactive (s=0). For the MWCmodel, the energy of the complex depends on s andσi in the following way:
E is the energy difference between the active and inactive state in the absence of ligand; each occupied receptor suppresses the activity by increasing the energy of the active state by ε>0; μ is the energy for ligand binding for the inactive state and depends on the ligand concentration and a dissociation constant, Ki, for the inactive state. All energies are in units of the thermal energy kBT. The correspondence between the energy parameters used here and that of the original MWC model can be summarized in the following: [L] is the ligand concentration. The dissociation constant for the active state, Ka, is simply given by: Ka=Ki/C. L is the equilibrium constant.
Given the Hamiltonian, the partition function Z is given by: From the partition function, all of the steady-state (equilibrium) properties of the model can be easily calculated. In particular, the average activity <s> can be determined:
exp(-E)=L,exp(-ε1)=C1,exp(-μ1)=[L1]/K1,exp(-ε2)=C2,exp(-μ2)=[L2]/K2exp(-E)=L,exp(-ε1)=C1,exp(-μ1)=[L1]/K1,exp(-ε2)=C2,exp(-μ2)=[L2]/K2
E. coli CheRB-- mutant with different induced Tar and Tsr expression levels j(strain) fj,1 fj,2 Nj,1 Nj,2 Aj(0) ------------------------------------------------------------------------------- 1 0.6 2 4.95 16.5 0.0806 2 1 2 4.00 8.00 0.0933 3 2 2 4.39 4.39 0.118 4 6 2 18.7 6.24 0.0875 5 1 0 14.0 0 0.0323 6 2 0 29.8 0 0.0645 7 6 0 73.5 0 0.0872 8 0 0.6 0 9.85 0.0133 9 0 1.4 0 15.2 0.0365 10 0 10 0 32.3 0.0983 ------------------------------------------------------------------------------- The receptor-specific parameters are found to be l1=1.23, C1=0.449, K1 49.2(μM) for Tar; and l2=1.54, C2=0.314, K2=34.5(μM) for Tsr.


![[Unix Programming] Signal and Signal Processing](https://cdn3.slideserve.com/5708599/unix-programming-signal-and-signal-processing-dt.jpg)