Download
1 / 13
780 likes | 3.03k Views
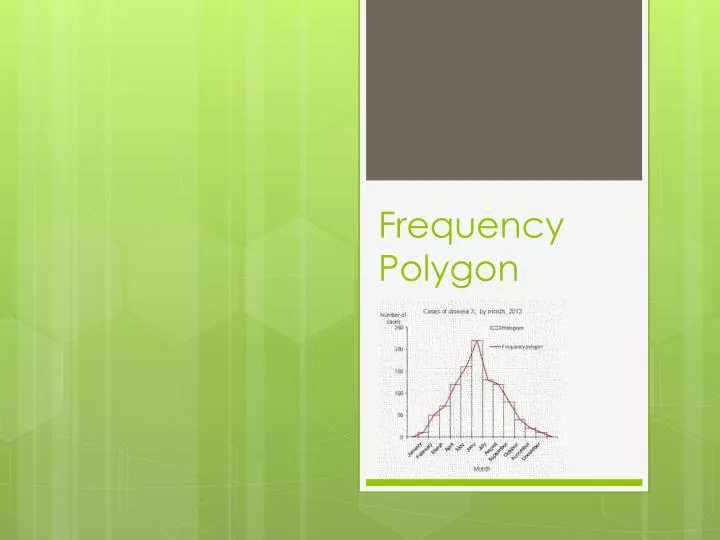
Frequency Polygon. Frequency Polygon. A frequency polygon is a line graph in which points are joined by straight lines and closed to make a polygon A frequency Polygon indicates the spread and skewness of distribution. Drawing Frequency Polygon.

E N D
Frequency Polygon • A frequency polygon is a line graph in which points are joined by straight lines and closed to make a polygon • A frequency Polygon indicates the spread and skewness of distribution.
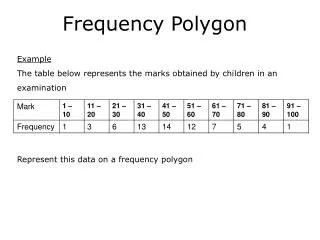
Drawing Frequency Polygon • A frequency polygon is drawn by plotting the frequency (or frequency density) against the midpoints of the data. • It can be superimposed on a histogram by connecting consecutive midpoints of the tops of columns • The area under the polygon represents the frequency of the data ( and is the same as the area of all the bars in the histogram)
Drawing Frequency Polygon • More Examples for you to try:
Analyzing Frequency Polygon • When the sample is large and there is a large number of intervals, since there are a large number of line segments the frequency polygon approaches FREQUENCY CURVE. • The Frequency Curve (or the Polygon) indicates the spread/dispersion of the distribution. Low Dispersion High Dispersion
Analyzing Frequency Polygon • A Frequency Curve (or the Polygon) also indicates the SKEWNESS (“lopsidedness”) of the distribution. • Normal Curve (symmetric) • Examples Weight, Height, IQ Test scores
Analyzing Frequency Polygon • A Frequency Curve (or the Polygon) also indicates the SKEWNESS (“lopsidedness”) of the distribution. • Positively Skewed Distribution • Examples Number of children in a family Age at which women marry Distribution of wages in a firm Positive side stretched
Analyzing Frequency Polygon • A Frequency Curve (or the Polygon) also indicates the SKEWNESS (“lopsidedness”) of the distribution. • Negatively Skewed Distribution • Examples Daily maximum temperatures for a month in summer Reaction times for a experiment Negative side stretched