Download
1 / 40
400 likes | 522 Views
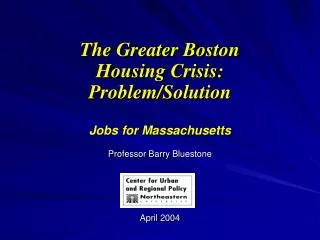
The Greater Boston Housing Challenge Barry Bluestone. Center for Urban and Regional Policy Northeastern University WBZ “Attaining the American Dream” October 27, 2005. How is Greater Boston doing … economically?.

E N D
The Greater Boston Housing Challenge Barry Bluestone Center for Urban and Regional Policy Northeastern University WBZ “Attaining the American Dream” October 27, 2005
How is Greater Boston doing … economically? • By the end of 2004, employment in Greater Boston was still down by more than 160,000 from its pre-recession peak • Real median household income dropped by 3.5% between 2000 and 2004
Greater Boston MSA Real Median Household Income 1969-1999 ($2004)
Greater BostonReal Median Household Income ($2004) 2000 2001 2002 2003 2004
How do the demographics look? • We are losing population to out-migration • The largest net losses in population were in the young prime age cohorts
Greater Boston Population 2000-2004 2000 2001 2002 2003 2004
Massachusetts Net Migration 2000-2004 2000-01 2001-02 2002-03 2003-04
What’s doing with the Cost of Living? • According to a new measure of living costs, Greater Boston has the highest cost of livingof any metro area in the United States • A family of four needs $64,656 to pay for the costs of housing, transportation, day care, health care, and other basic necessities. • This is more than $3,000higher than in Washington, D.C;$6,000higher than in New York City;and $7.000more than in San Francisco • Monthly housing costs are40% higherthan in Austin, Chicago, and Miami and 63% higher than in Raleigh-Durham-Chapel Hill
Boston Monthly Housing $1,266 Monthly Food $ 587 Monthly Child Care $1,298 Monthly Transportation $ 321 Monthly Health Care $ 592 Monthly Other Necessity $ 500 Monthly Taxes $ 824 Monthly Total $5,388 Annual Total $64,656 Raleigh-Durham-Chapel Hill Monthly Housing $ 779 Monthly Food $ 587 Monthly Child Care $ 866 Monthly Transportation $ 358 Monthly Health Care $ 368 Monthly Other Necessity $ 369 Monthly Taxes $ 350 Monthly Total $3,677 Annual Total $44,124 A Tale of Two CitiesBasic Budget2 Parents, 2 Children
Rents and Prices • With a vacancy rate of 6%, average effective rents remained relatively stable in 2004 (February 2005) after declining from peak rents in 2000 • $1,748 for Class A Apartments (-5.1% since October 2002) • $1,187 for Class B Apartments (-3.7% since October 2002) • $967 for Class C Apartments (-4.0% since October 2002) • From May 2004 to February 2005, rents have remained largely unchanged
2005Class A Apartment Rents Source: Forbes Magazine
Affordability Problem Persists for Renters in Greater Boston • The number ofcost burdened renters in 2003 increased to nearly 50%of all renter households -- from 43.3% in 2002 • The number ofseverely cost burdened renter households(those paying over 50% of income for rent)swelled to nearly 25%-- from 21.5% in 2002 • Despite softening in area rents over past 2 years, rent levels remain high throughout most of the region • Although there were 34,000 fewer renter households in the Boston PMSA than in 2000, 19,000 more faced severe cost burdens
Owner Occupied Housing Affordability • By 2004, households earning the median income of their city or town could afford its median priced single family home in only 27of the161 towns and cities in the region, down from 77 in 2002 and 148in1998. • In only 1 town in Greater Boston could first time homebuyers earnings only 80% of municipal median income afford a home that sold for 80% of the median priced house … down from 17 in 2002 and 116in 1998.
Is it any wonder then …. • That we are losing young people who can’t afford Greater Boston’s cost of living • That we are losing jobs because firms have difficulty in finding sufficient labor for their enterprises at nationally competitive wage rates
New Housing Production – Some Good News • Building permit issuance increased by 12% in 2004 to 13,556 after increasing by 22% in 2003. • For the first time since 1998, permits for single family units increased ... to 7,000 in 2004 from 6,020 in 2003 • BUT, total permits remain well below peak years of the 1970s and 1980s when more than 20,000 units/year were permitted • And, single units permits are still well below the number issued each year from 1998 through 2000.
Housing Production in the Boston PMSA vs. Housing Goals in the New Paradigm Report …
Conclusion • Greater Boston now has the highest living costs of any metro area in the United States …. led by high housing costs (as well as by high medical and day care costs) • It is not surprising then that Greater Boston and Massachusetts are losing population, especially among young working families, to other regions of the country • Housing production has improved in Greater Boston over the past three years, but total production in 2004 was still at only 72 percent of the level needed to slow housing price appreciation to normal levels • We still need to encourage more housing production as a “moral imperative” and as an “economic necessity”
5 Solutions for Housing Affordability • Zoning for Housing Affordability • Comprehensive Permit Statute (Ch. 40B) 40% of all new production 80% of all new affordable housing in suburbs • Smart Growth Housing Production (Ch. 40R) Upfront bonus payments School costs reimbursements • Inclusionary Zoning (10-15% of market rate developments)
Increased State Investments • Affordable Housing Trust Fund for new production • Preservation of Existing Subsidized Housing (public housing and expiring use) • Business Community Involvement • Investments in state tax credits (housing, historic preservation, brownfields) • Employer assisted housing to increase homeownership • Support for local housing proposals
Compact Between State and Municipalities • Increased support for community planning • Technical assistance for housing development (Community Preservation Act) • Greater Public Awareness and Education
Home@Last Campaign: • Educate community members about the benefits and importance of affordable housing • Video, posters, brochures, media and advertisements • Community presentations to civic groups, municipal officials, and others
Conclusion: Ingredients for Success • Partnership between the public and private sector • Leadership from the Governor and Legislature • Greater local support and involvement

![BRANDING MARKETING GREATER BOSTON [Lessons from Barcelona]](https://cdn4.slideserve.com/1045317/slide1-dt.jpg)