Download
1 / 27
270 likes | 273 Views
ASAR Validation Review AP and GM Level 0 Product Quality Birgit Schättler Remote Sensing Technology Institute German Aerospace Center (DLR). Overview. Objectives and Approach Downlink Data Quality Echo Data Statistics Detailed Analysis of an AP Level 0 Product

E N D
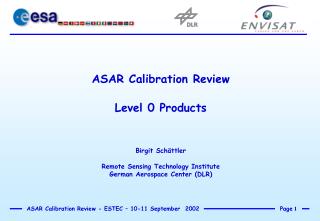
ASAR Validation Review AP and GM Level 0 Product Quality Birgit SchättlerRemote Sensing Technology InstituteGerman Aerospace Center (DLR)
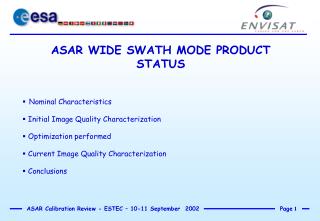
Overview Objectives and Approach Downlink Data Quality Echo Data Statistics Detailed Analysis of an AP Level 0 Product Detailed Analysis of a GM Level 0 Product Summary and Conclusions
ensure, that ASAR AP and GM level 0 products do not show systematic deficiencies start the quantitative analysis of raw data parameters like echo data statistics, noise measurements, … Objectives
Evaluate systematically and automatically level 1B product annotation parameters related to level 0 product quality (e.g. downlink data quality, echo data statistics, noise measurements ) using a tool incorporated into the PDS functionality not yet available => only restricted systematic analysis possibilities based on CBTS (“Chris Buck Tool Set”) Perform a detailed analysis of selected level 0 products using SARCON, an off-line SAR product quality analysis software Approach
AP systematic analysis based on annotations of 106 products only : 57 APM, 49 APP 18 IS 1 : 1 VH 8 VV VH 9 HV HH, 24 IS 2 : 3 HH 13 VV VH 5 HV HH 3 VV HH 8 IS 3 : 2 VH 6 VV VH 22 IS 4 : 2 VH 4 HH 8 VV VH 8 HV HH 16 IS 5 : 2 VH 6 VV VH 8 HV HH 8 IS 6 : 5 VV VH 3 HV HH 10 IS 7 : 3 VV VH 7 HV HH AP Systematic Analysis
missing range lines detected in 3 products:1 with 7 missing, 2 with 1 missing each product with 7 missing range lines has 2 corrupted auxiliary codes, all other products show no auxiliary code error at all missing lines percentage = 0.00014 % (9 missing out of 6392012) Good downlink data quality can be assumed AP Downlink Data Quality Summary
ASA_APH_0PNPDK20021106_094707_000000892011_00022_03583_0043.N1ASA_APH_0PNPDK20021106_094707_000000892011_00022_03583_0043.N1 Netherlands calibration site with transponders in H/V and H/H polarisation, beam IS 6 “nominal timeline anomaly” no anomalies observed Detailed Analysis of an AP IS 2 Product
no missing / erroneous ISPs no missing range lines no errors in analysed auxiliary codes perfect downlink data quality Downlink Data Quality
initial noise : 8 lines in HV and 8 lines in HH initial calibration sequence : 97 pulses in HV and 97 pulses in HH pre-flight observed anomaly in periodic cycle is now the nominal case handled by PF_ASAR timeline according to expectation AP Timeline (Initial Cycle)
pre-flight observed 237 echo + 1 cal in HV 237 echo in HH 237 echo in HV 238 echo in HH ----------------------- 238 echo in HV 237 echo + 1 cal in HH 238 echo in HV 238 echo in HH ----------------------- 237 echo + 1 cal in HV 237 echo in HH 237 echo in HV 238 echo in HH ----------------------- . . . . . . AP Timeline (Periodic Cycles) specified 237 echo + 1 cal in HV 238 echo in HH 238 echo in HV 238 echo in HH ----------------------- 238 echo in HV 237 echo + 1 cal in HH 238 echo in HV 238 echo in HH ----------------------- 237 echo + 1 cal in HV 238 echo in HH 238 echo in HV 238 echo in HH ----------------------- . . . . . .
no echo data saturation dynamic range not fully used Q channel Q channel I channel I channel Echo Data Histograms and Statistics HV polarisation I Bias = 0.001730 Q Bias = 0.001793 I Stddev = 0.051607 Q Stddev = 0.051510 IQ Gain imbalance = 1.001875 IQ Non-orthogonality = 0.003519 HH polarisation I Bias = 0.001765 Q Bias = 0.001854 I Stddev = 0.122002 Q Stddev = 0.121865 IQ Gain imbalance = 1.001119 IQ Non-orthogonality = 0.004364
Echo Data Visual Inspection HH HV no anomalies observed
Range-Compressed Data Visual Inspection no anomalies observed HH HV
ASA_GM__0PNPDK20021114_071147_000001062011_00135_03696_0211 in VV polarization region in the north of Russia anomaly observed with instrument characterization file : wrong subsampling factors for beam SS2 … SS5corrected INS file delivered by ESRIN Detailed Analysis of a GM Product
no missing or erroneous source packet no single error in analysed auxiliary codes (PRI, SWST, SWL, up/down converter, TX pulse length, TX pulse bandwidth, resampling factor) perfect downlink data quality Downlink Data Quality
no echo data saturation dynamic range not fully used Echo Data Histogram Q I SS1 SS5
Echo Data Statistics swath SS1: I Bias = 0.001516, Q Bias = 0.001479 I Stddev = 0.070892, Q Stddev = 0.070799 IQ Gain imbalance = 1.001307, IQ Non-orthogonality = 0.002945 swath SS5: I Bias = 0.001495, Q Bias = 0.001429 I Stddev = 0.080410, Q Stddev = 0.080333 IQ Gain imbalance = 1.000956, IQ Non-orthogonality = 0.001402
SS1 Echo Data Visual Inspection
Initial Calibration Pulses P1 P1A P2 P3 SS1
Periodic Calibration Pulses P1 P1A P2 P3 SS1
Analysed AP and GM level 0 products show a good overall product quality. First AP quantitative measurement results could be obtained, but based on a small variety of products only Only one GM product available Summary and Conclusions (I)
Detailed analysis of selected level 0 products will be done only for “suspicious” products in the future The operational PDS tool for a systematic and automatic parameter evaluation is urgently needed- as indicator for possible anomalies - for further overall quality assessment - for further quantitative measurements Summary and Conclusions (II)