Download
1 / 58
580 likes | 614 Views
Dive into the world of meteorology with this detailed introduction to weather and climatology. Learn about the atmosphere, weather variables, climate patterns, and how to analyze climographs. Discover the difference between weather and climate, and explore various tools for observing the atmosphere like thermometers, barometers, anemometers, and radar systems. Understand the composition of the atmosphere and the Earth-Sun relationships that influence our weather. Engage in hands-on activities and satisfy your curiosity about the science behind the skies.

E N D
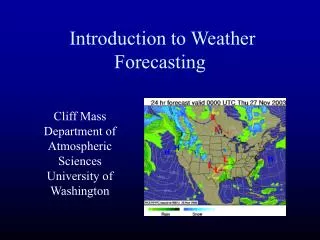
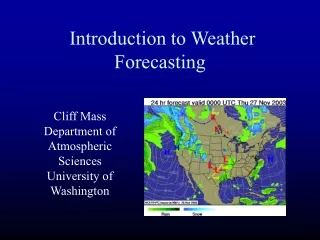
Meteorology: the study of the physics, chemistry, and dynamics (movement) of the Earth’s atmosphere • Atmosphere: Envelope of gases bound to the Earth by gravity • Weather: State of the atmosphere at a given time and place; constantly changing • Weather is described by variables such as: • Temperature • Pressure • Wind Speed and Direction • Precipitation • Cloud Cover
Climatology: study of climate types and patterns and the causes of those patterns • Climate: sum of all statistical weather info that helps describe a place or region • Slowly - varying • Averages (monthly, yearly) • Ranges (largest value - smallest value) • Extremes (maximum, minimum) Climograph: graph showing how average monthly temperature and precipitation values change throughout the year at a particular location
Climate data source: www.worldclimate.com Making climographs and analyzing data: 3.5.3, 4.5.4, 6.2.1, 6.2.2, 6.2.6, 6.5.4
Weather or Climate??? • The average high temperature for the month of July in Chicago is 84oF. • Cumulus clouds presently cover the entire sky. • Snow is falling at a rate of 1 inch per hour. • The summers here are warm and humid. • At 3:00 p.m, winds were blowing from the NW at 10 mph. • Total precipitation at O’Hare Airport for 2003 was 32.02 inches, which is 4.25 inches below normal. • Weather vs. Climate: 3.6.5
Observing the Atmosphere • Temperature: measure of the motion of the molecules in a substance • Hot air: molecules moving more quickly • Cold air: molecules moving less quickly • Measured using a thermometer • Always measured in shady conditions • Units: oC, oF
Observing the Atmosphere • Air Pressure: force per area exerted by the mass of air above a point • Measured in: • Inches of mercury (in. Hg) • Millibars (mb) • Average sea-level pressure = 1013.25 mb or 29.92 in. Hg • Measured using a barometer
Mercury Barometer Aneroid Barometer
Observing the Atmosphere • Wind Speed: How fast is the air moving? • Measured in: • Miles per hour (mph) • Nautical miles per hour (knots) • 1 knot = 1.15 mph • Wind direction • The direction from which the wind is blowing • A southerly wind is coming from the south.
Observing the Atmosphere • An anemometer (left) measures wind speed. • A wind vane (right) measures wind direction.
Observing the Atmosphere • Atmospheric Moisture • Dewpoint: the temperature (oC, oF) to which air must be cooled for saturation (and condensation) to occur • Air saturation: when the amount of water vapor in the atmosphere is at its max possible at the existing temp and pressure. • Condensation: process by which water vapor (gas) becomes liquid water • Process by which clouds form
Observing the Atmosphere • Precipitation • Rainfall amount • Rain gauge • Snowfall amount • Yardstick • Measured in inches, centimeters, or millimeters
Observing the Atmosphere • Radiosonde: balloon-borne instrument that measures upper-air pressure, temperature, and moisture • Data radioed back to surface station • Upper-air data collected 2x per day
Observing the Atmosphere • Radar: “Radio Detection and Ranging” • Radar sends out microwave energy pulses • Energy is reflected by particles in atmosphere (precipitation) • Radar dish collects reflected energy and graphically depicts the location and intensity of precipitation • Doppler radar can sense movement of precipitation, which helps find rotation in severe thunderstorms
Doppler radar tower The radar dish is enclosed within the radome, which protects the dish from adverse weather conditions. How radar works
The larger the reflectivity value (red, orange), the higher the rainfall and/or hail rate.
Observing the Atmosphere:Applicable Indiana Standards • Scientific Inquiry: 3.1.2, 3.1.3, 3.1.4, 4.1.2 • Technology and Science: 4.1.5 • Manipulation and Observation: 3.2.3, 5.2.4 • Communication Skills: 6.2.6 • Earth and Processes that Shape it: 3.3.5 • Numbers: 3.5.1, 3.5.2, 5.5.1 • Shapes and Symbolic Relationships: 3.5.3, 4.5.4, 6.5.4 • Constancy and Change: 3.6.4, 5.6.4
Composition of the Atmosphere * Troposphere * 0 - 11 km * Weather * Temp decreases as height increases * Stratosphere * Temp increases as height increases * Ozone: absorbs harmful ultraviolet (UV) radiation from Sun
Composition of the Atmosphere Force of gravity: 5.3.6, 5.3.13
Earth – Sun Relationships • The Earth revolves in its orbit around the Sun every 365 days (1 year). • The Earth rotates on its axis every 24 hours (1 day). • The Earth’s axis is tilted 23.5o from the vertical. • The seasons are due to the tilt of the Earth’s axis and the spherical shape of the Earth’s surface. • Revolution, Rotation, Tilt, and Seasons: 4.3.8, 6.3.3, 6.3.5
During the summer, the Northern Hemisphere is tilted towards the Sun. Here, locations receive the Sun’s most direct rays, and have longer periods of daylight hours. During the winter, the Northern Hemisphere is tilted away from the Sun. Periods of daylight are shorter, and the Sun’s rays are less direct.
During the vernal (spring) and autumnal (fall) equinoxes, neither hemisphere is tilted towards or away from the Sun. On these dates, every location on Earth receives 12 hours of daylight and 12 hours of darkness.
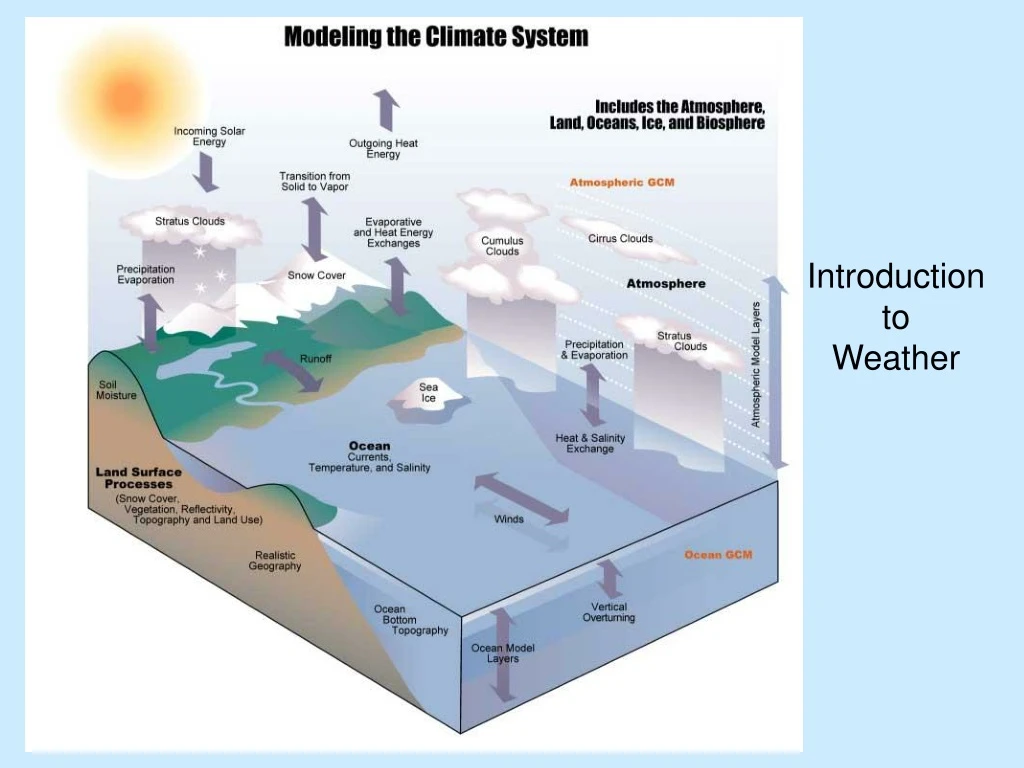
What happens to sunlight when it enters the atmosphere? *Note that the atmosphere itself does not absorb a large percentage of incoming solar radiation (sunlight).
How does the Earth’s atmosphere warm? About 50% of the incoming solar radiation is absorbed by the Earth’s surface. Most of the molecules in the Earth’s atmosphere do not absorb visible or shortwave radiation. The Earth’s surface warms, and emits energy in the form of infrared or longwave radiation, which is invisible to the human eye. Certain molecules in the atmosphere, called greenhouse gases, do absorb the Earth’s infrared radiation. This absorption warms the atmosphere. Also, the greenhouse gas molecules emit their own infrared radiation, which is absorbed by other molecules, and the atmosphere warms even more!
Greenhouse Gases • Carbon Dioxide • Water Vapor • Methane • Nitrous Oxide • All of these gases are occur naturally in the atmosphere, but human activities, such as the burning of fossil fuels (coal, oil, and natural gas), have caused atmospheric concentrations of these gases to increase dramatically since around 1850. • Human effect on atmosphere: 3.3.7, 6.3.13
Annual cycle of the amount of sunlight received at the surface.
Global Heat Transfer • The tropics receive more solar energy than the poles every year. • How come the tropics aren’t getting progressively warmer and the poles aren’t getting progressively colder? • Answer: Redistribution of heat by atmospheric circulations and ocean currents!
What determines temperature? • Latitude: locations at lower latitudes typically experience higher temps year-round than higher latitude locations, because the lower latitudes receive more solar energy • Proximity to water: locations near water, especially a cool ocean current, have smaller annual temp ranges than landlocked locations • Elevation: locations at higher elevations usually have cooler conditions than locations at lower elevations
Water vs. Land Effects of oceans on climate: 4.3.4, 6.3.11
The Global Water Cycle • Evaporation: liquid water becomes gas (vapor) and enters the atmosphere • Transpiration: water vapor is released into the atmosphere by trees and plants • Condensation: water vapor in atmosphere becomes tiny liquid droplets • Precipitation: liquid or frozen particles fall to the ground and return moisture to the surface • Runoff: excess precipitation flows downhill over surface towards stream, river, or lake • Percolation or Infiltration: movement of water through underlying rock and soil.
Clouds • On Earth, water naturally occurs in all 3 phases or states of matter (gas, liquid, solid) • Clouds are composed of tiny liquid water droplets or tiny ice crystals. • Clouds are not made of water vapor (Otherwise, we wouldn’t be able to see them!) • In nature, clouds form when the temperature of air is lowered to its dewpoint temperature. • Water phases and water cycle: 5.3.4, 5.3.8, 6.3.9 • Clouds: 5.3.5
Cloud Types • Three main cloud types: • Cirrus: High, thin, wispy clouds made of ice crystals. Usually occur above 20,000 ft (6000 m) • Stratus: Low, uniform, horizontal grayish clouds with bases below 6,500 ft (2000 m) • Fog: Stratus cloud in contact with the ground. • Nimbostratus: Dark gray stratus clouds from which precipitation is falling • Cumulus: Relatively small, puffy clouds that resemble cotton balls and occur on fair weather days • Note: All cloud photos on following pages can be found online at www.cloudman.com
Cumulus Cirrus Stratus Fog
Cloud Types • Category subdivisions: • Cirrocumulus: high, small, white, rounded patches arranged in a wavelike or mackerel pattern; made of ice crystals • Cirrostratus: widespread, high cloud sheet made of ice crystals • Altocumulus: roll-like patches or puffs that often form in waves or parallel bands; found between 6,500 ft and 23,000 ft; made of ice crystals and liquid water droplets • Altostratus: uniformly gray layers that completely or partially cover the sky; found between 6,500 ft and 23,000 ft; made of ice crystals and liquid water droplets
Cirrocumulus Cirrostratus Altocumulus Altostratus
Cumulonimbus (Thunderstorm) Cloud • Cumulus – type cloud extending from near the surface to the top of the troposphere. • Produces heavy rain, strong surface winds, hail, lightning, and occasionally tornadoes. • Composed of ice crystals (near top) and liquid water droplets
Air Pressure and Winds Air pressure is the weight of the air above you. Air pressure decreases with altitude as you go up, because less air remains above you.
Air Pressure and Winds • Horizontal (east/west, north/south) differences in air pressure cause the air to move Wind! • The force that causes the air to move is called the pressure gradient force. • The pressure gradient force always moves air from higher pressure towards lower pressure, in an attempt to equalize pressure everywhere. • Air pressure and wind: 4.3.2
The greater the pressure difference between two locations, the faster the wind will blow from high pressure to low pressure. Forces and motion: 5.3.11
Basic Weather Map Features • Isobars: lines that connect values of equal air pressure, usually drawn in millibars (mb) • High Pressure Centers (H) • Low Pressure Centers (L) • Front: boundary between two different air masses • Cold front: cold air mass is advancing • Warm front: warm air mass is advancing • Stationary front: neither air mass is moving
In N. Hemisphere: Air flows counterclockwise and into a low pressure center. Air flows clockwise and out of a high pressure center.