Download
1 / 27
270 likes | 375 Views
The Social and Economic Setting. Chapter 3. How to Judge a Successful Country. Material Well-Being. Comparisons to the US usually make Canadians feel badly about their economic well-being On a global scale, we are among the 10 richest countries in the world.

E N D
The Social and Economic Setting Chapter 3
Material Well-Being • Comparisons to the US usually make Canadians feel badly about their economic well-being • On a global scale, we are among the 10 richest countries in the world. • The question is whether we are continuing our material well-being or falling behind other countries?
Change in Canadians Jobs • Initially Canadian jobs relied on the primary sector, wood, water, agriculture. • Moved to industrial jobs in Eastern Canada with factory work.
Service Sector • Criticism of free trade was that the high-paying manufacturing jobs would be lost to low-paying service sector jobs. • McJobs. • The reality is far different.
Class definitions • Bourgeoisie: owners of the means of production. • Proletariat: the workers. • Small petite bourgeoisie: farmers, small-business people, self-employed professionals. • Middle class: civil servants, teachers, nurses, and other salaried professionals.
Rich getting richer? • More than half of Canadians at the bottom of the income distribution in 1989 managed to better their relative income position by 1994. • Of the top one-fifth income recipients in 1989, 70% remained in the highest quintile in 1994.
Poor getting poorer? • Overall, 29% of Canadians receiving income in 1989 were in a better relative income position in 1994. • On the other hand, 17% moved to a lower position in the income distribution. • A large proportion of the 1989 income recipients (44%) were in the same quintile in both years.
Is Class a static existence? • Much of the improvement in relative income position can be explained by aging (1989 income recipients were five years older in 1994). • Earnings - the largest component of income for most Canadians - usually increases as individuals age through their younger and middle years and then decreases in later life.
Women • Women were more likely than men to improve their relative income position. • Just over a third of all female income recipients in 1989 moved up a quintile by 1994, while only a quarter of males advanced. • More than half (58%) of the women receiving income in 1989 remained in the same quintile or dropped to a lower one, while 64% of the male income recipients were in the same relative income position or moved down.
Women Improving • The tendency for women to move up the income distribution more often than men may simply reflect where women are to begin with - in the lower quintiles. • In both 1989 and 1994, there was a larger proportion of women in the lowest quintile. On the other hand, a higher proportion of men were in the highest quintile in both years. • There was a shift, however, in these proportions from 1989 to 1994. The proportion of women in the lowest quintile decreased from 69% in 1989 to 66% in 1994. In the top quintile, the proportion of women increased from 22% to 28%.
Power, Class and Voting • Upper class comprises 2.5 of the electorate. • Working class comprises 67.5 percent. • Poor represents 15 percent of the electorate.
The Corporate Elite • There are few at the very top. • These few have interlocking companies and control huge empires. • There is cross-ownership and board membership between corporations and banks.
Demands of the Corporate Elite • Maximize profits. • Reduce government intervention in the economy. • Low taxes. • Limit regulations.
How these demands help all Canadians • Individuals own companies. Corporations do not pay taxes, but taxes are paid on incomes earned from companies as well as on shareholder earnings. • Low corporate taxes translate to more jobs.
The Working Class • Petite bourgeoisie wealthier than the new middle class and have tax breaks to benefit. • Self-employed persons own the means of their production and are therefore more likely to have false consciousness.
New Middle Class • Salaried semi-professionals • Unionized • Well-educated • Economically comfortable • Bear the brunt of the tax burden. • Middle class is also the largest group.
Working Class • Manual or routine work • Receive less income than middle class • Often less qualified, or conduct non-trade work. • Large differences between unionized and non-unionized working class.
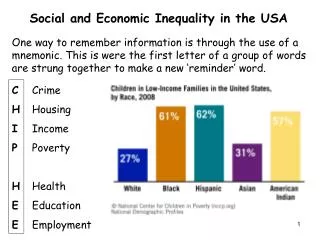
The Poor • Those living below the poverty line. • In Canada, no official poverty line exists. • Statistics Canada uses a low income cutoff and cautions against using this as a poverty line.
What does it mean to be poor in Canada? • LICO is a relative measure, and therefore by definition, there will always people living below this measurement. • Some measurements of poverty examine what people have rather than income levels.
Do Classes exist in Canada? • Can class consciousness be measured in ways other than income, education, or occupation? • Do Canadians vote according to class interests? • Is there mobility from one class to another in Canada?
Quality of Life • We have low infant mortality rates • High life expectancy 75 (M) 81 (F) • Homicide rate is low, violent crime on the decline. • Fewer homeless people compared to other countries. • How do we explain increased use of food banks?
Independence • Self-government • Power to enter foreign treaties (1931) • Power to amend the constitution (1982) • power to interpret the constitution (1949) • Economic relations • Cultural independence
Summary • Measuring our success as a nation is not an easy task. • While we have equality rights, relative wealth and longevity, problems exist. • Is Canada the best country to live, is probably not the best question. • A better question is whether Canadians are happy with the compromises made.
Summary • Workers provide the means for wealth accumulation for the owners. • Owners obtain disproportionate attention and resources to government. • Government’s placate workers and poor to gain votes.