Download
1 / 50
520 likes | 811 Views
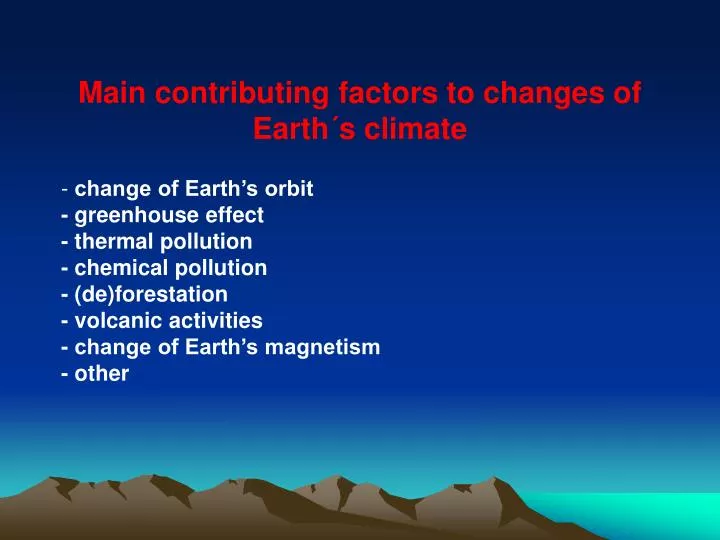
Main contributing factors to changes of Earth´s climate change of Earth’s orbit - greenhouse effect - thermal pollution - chemical pollution - (de)forestation - volcanic activities - change of Earth’s magnetism - other.

E N D
Main contributing factors to changes of Earth´s climate • change of Earth’s orbit • - greenhouse effect • - thermal pollution • - chemical pollution • - (de)forestation • - volcanic activities • - change of Earth’s magnetism • - other
History of greenhouse effect1827. Jean B. J. Fourier:«Light find less resistance in penetrating the air, than in repassing into the air when converted to heat.» 1860. John Tyndall:showed that CO2 and water vapor both absorb and emit infrared radiation.1896. Svante Arrhenius:showed by calculation in a simplified model that a 50% increase of CO2 would warm the Earth´s surface by 3 oC.1914.-1938. Milutin Milanković:showed by calculation that a quasiperiodic change of Earth´s orbit around Sun causes the interchange of global warming and global cooling.
1938. Stewart Callender:in a simple model predicted that projected increase of atmospheric CO2 would increase the temperature by about 0.3 oC per century.1960.-1980. actual global cooling:provided a scientific argument against attribution of early 20th century warming to CO2 increase.1982. US NAScomputed based prediction that doubling of CO2 atmospheric concentration would lead to increase of temperature of 1.5-4.5 oC.2007. IPCC 2007computed based prediction increase of CO2 atmospheric concentration in 21st century would lead to increase of temperature of 1.1-6.4 oC.
CO2 concentration in atmospherebefore 35 000 000 years 2,000 ppmbefore 20 000 years 200 ppm1807. 280 ppm1858. 288 ppm1914. 300 ppm1950. 310 ppm1970. 325 ppm1985. 345 ppm2007.380 ppm
OCEANS – ATMOSPHERIC CO2 SINKVolcanoes bring CO2 and volcanic rocks from deep inside the Earth to the surface.Rainfall picks up some CO2 from the atmosphere making a weak acid. That acid breaks rocks down and particles of rock and CO2 are washed to the ocean.Chemical reaction stores CO2: rock (CaSiO3) + CO2sediments at ocean floor (CaCO3 + SiO2)
The rate at which CO2 is removed from the atmosphere increases with increasing temperature. Therefore, greenhouse effect acts as thermostat. During the last 8,000 years human activity was introducing additional CO2 into atmosphere.Ocean absorbs 50% of yearly CO2 production.Lifetime of atmospheric CO2 is about 100 years (before being absorbed by oceans, soil and biosphere)!CO2 Cycle:volcanoes atmosphere ocean sediments Earth´s interior volcanoes .....
«JUMPING» CLIMATECLIMATE OVER THE PAST 100,000 YEARSOver the past 100,000 years there were only two vaguely stable periods of climate: - the first was when the ice age was coldest, about 20,000 years ago, during period of a few thousand years, and - the second is the recent period over the last 10,000 years.But for the most of the last 100,000 years, a «jumping» climate has been the rule, not the exception. Slow cooling has been followed by abrupt cooling, centuries old, and then abrupt warming, with the abrupt warming generally about 1,500 years apart, although with much variability.
At the abrupt jumps, the climate often flickered between warm and cold for a few years at the time before settling down. The best known abrupt climate change, the Younger Dryas event 11,500 years ago, when Greenland warmed about 8 oC in a decade.The history of this climatic «craziness» is written down in the ice of Greenland and Antarctic, in cave formations, ocean and lake sediments and other places. This million-year archive provides year-by-year records of air and water temperature, ice sheets, storms, oceans etc.
The current stable climate interval is among the longest in the record of global climate! Nature is thus likely to end our friendly climate, perhaps quite soon.In such a situation one should be careful not to provoke it!EARTH IS A SENSITIVE DYNAMIC «BEING», UNDERGOING CONTINUOUS CHANGES!
CONCLUSIONS:1.Climate in the past has been wildly variable, with larger and faster changes than anything humans have ever faced during last five thousand years2. Climate can be rather stable during some times, but when the climate is «pushed» or forced to change, it often jumps suddenly to very different conditions. 3. Small «pushes» have caused large changes because many processes in the Earth´s system amplify the pushes
(similar to sensitive dependence of deterministic chaos for nonlinear systems).Greenhouse gases have probably been important amplifiers.The great ice sheets that grew to cover much of Europe and North America only 20,000 years ago were responding to changes in the Earth´s planetary orbit.4. There is remarkable evidence for «jumping» climates, which have been especially prominent during coolings and warmings of the orbitally driven ice ages.AND SUCH SITUATION IS ABOUT NOW!
IPCC (Intergovernmental Panel on Climate Change)Previous IPCC predictions: from 1990. onwards global temperature would rise by between 0.15 oC and 0.3 oC per decade.The actual increase after 1990.:0.2 0C per decadefits the initial prediction.
IPCC Report (2007):With over 90% probability («very likely») recent temperature increases are driven by human activities.Estimate of CO2-doubling response:2.0-4.5 oC mean temperature rise resulting from doubling of CO2 level. Prediction for temperature increase in 21st century:1.1-6.4 oC.Predictions of rise of sea level in 21st century :between 19 cm and 58 cm.
HOW REALISTIC ARE MATHEMATICALMODELS OF GLOBAL CLIMATE?To predict future climate it is necessary to develop mathematical model of physical processes in the coupled system of atmosphere, oceans, ice sheets, biosphere, human activities etc. Because of extreme complexity, only very simplified models are available what seriously limits the reliability of model predictions. This was shown many times by inability of climatic models to predict many known climatic changes from the past, starting the model earlier in the past and seeing whether the model can «predict» the things that we know have happened.Therefore, science can not give fully reliable prediction for future climate, but only more or less probable outcomes (it is even uncertain how large is the probability).Much more research is needed!
NATURE (2007) What we don´t know about climate changeReport from IPCC (Intergovernmental Panel on Climate Change) (2007) has a finely calibrate lexicon of certainty: «virtually certain», «very likely», «more likely than not» when assigning the probability of climate effects of human activities. Some conclusions remain more uncertain than the others.Perhaps most critically, researchers know relatively little feedback effects that might enhance- or weaken – the pace and effects of climate change. The complex flow of carbon between soils, plants, the oceans and the atmosphere is still being investigated.
Key sticking points include the inability of global climate models to produce the amount of sea-level rise observed over the past couple of decades.IPCC Report gives first forecasts how changing climate might affect particular regions of the world, but improved analyses that incorporate clouds, snow and ice must be developed.Extreme weather is another example of the remaining uncertainties.Improving the models requires better data. Gaps and errors in observation are attributable to many causes. Caution is necessary in interpreting the IPPC data!
NATURE 419(2002) K.Lambeck et al. Links between climate and sea levels for the past three million yearsThe major sea-level cycles occur at intervals of about 100,000 years over the past about 800,000 years, with maximum amplitude of 120-140 m.NATURE 445 (2007) G.J. Bowen, When the world turned coldBefore 34 million years, Antarctica has been a lush, green continent for several tens of millions of years.Then, in a period of 300.000 years temperature dropped by about 8 oC and CO2 concentration dropped several times from its initial value of about 2,000 ppm to about few hundred ppm. Ice sheets grew over most of Antarctica.NATURE, 446 (2007). S. Bain et al. Effect of natural iron fertilization on carbon sequestration in the Southern OceanIron concentration in surface waters plays important role on the uptake of carbon in oceans and may have more significant effect on atmospheric CO2 concentration than previously thought.
NATURE, 446 (2007) Q. Shiermeier, The new face of ArcticHow the Arctic might change in 2027.- The Arctic Ocean remains ice-free in September.- All known Russian offshore oil and gas deposits are exploited commercially.- Offshore oil and gas resources unknown today are being extensively developed.- Oil tankers and container ships sail the Northeast passage.NATURE, 426 (2003) Q. Shiermeier, Climate study highlights inadequacy of emission cutsThe Kyoto Protocol calls for average cuts of 5% by 2012.German Advisory Council on Global Change concludes that global CO2 emissions would need to be curbed by 45-60% by 2050 compared with 1990 levels.
NATURE, 448 (2007) P. Pilewskie, Aerosols heat upSolid particles suspended in atmosphere have long played second fiddle to greenhouse gases as agents of climate change. A study of atmospheric heating over the Indian ocean could provoke a rethink.SCIENCE, 286 (1999) J.P. Severinghaus, Abrupt climate change at the end of last glacial periodGreenland warmed 9 oC (6-12 oC) abruptly over a period of several decades, beginning 14,672 years ago.NATURE, 448 (2007) V. Ramanathan et al. Warming trends in Asia amplified by brown cloud solar absorptionWe suggest that atmospheric brown clouds contribute as much as the recent increase in anthropogenic greenhouse gases to regional lower atmospheric warming trends. We propose that the combined warming trend of 0.25 oC per decade may be sufficient to account for the observed retreat of the Himalayan glaciers.
NATURE, 448 (2007) N. Stafford The other greenhouse effectCommercial greenhouses contain 700 ppm or more of CO2 .Rising CO2 concentration increases crop yields but decreases nutritional quality.NATURE, 404 (2000) C.S. Hvidberg, When Greenlad ice melts130,000 to 110,000 years ago the climate was warmer than today, and the sea level was six meters higher than today.20,000 years ago the sea level was 120 meters lower than today.NATURE, 448 (2007) O. Norton, Is this what it takes to save the world?Geoengineering can be used to cool the Earth.Introducing one or two million tons of sulphur into the stratosphere every year as a way to keep the protective effects. Large number of sliver-like fliers could be launched from Earth and used to partially shield the Earth from Sun´s rays (to cut down sunlight by about 2%).
NATURE, 448 (2007) M. Hopkin, Climate panel offers ground for optimismIf CO2 emissions were given a cost of 50 USD per tonne, economic forces could drive global emissions in 2030 20% to 50% lower than they would otherwise have been. Technologies and practices that can help mitigate climate change (sector energy)Currently available:More efficient supply and distribution Combined heat and power Renewables Nuclear Early carbon capture and storageCommercially available by 2030:Carbon capture and storageAdvanced nuclear powerAdvanced renewablesNew solar concentrators and cells
GOALS:People should be better educated and informed! Scientific and technological development should provide more energy efficient and environmentally friendly devices!Scientific and technological development should provide abundant and ecologically cleaner energy sources!We should change our lifestyle to spend less energy!Getting the people ready for action, rather than passive or depressed!
Climatic Change in Croatia 5-year mean temperature in 1999.-2003. and 2004.-2008. in Croatia. Input mean annual temperature data are taken from Meteorological and hydrological service of Republic of Croatia. Fourteen climatological stations are chosen randomly from the station network in Croatia, including coastal, continental and mountain regions.
Climatological Mean temperature (°C) Temperature change (°C) station 1999.-2003. 2004.-2008. Zagreb 13.02 12.68 -0.34 Osijek 11.84 11.56 -0.28 Pozega 11.82 11.36 -0.46 Gospic 9.86 9.58 -0.28 Crikvenica 15.58 15.15 -0.43 Hvar 17.16 16.82 -0.34 Split 16.96 16.66 -0.30 Dubrovnik 17.22 16.84 -0.38 Varazdin 11.40 11.04 -0.36 Daruvar 11.48 11.06 -0.42 Ogulin 11.22 10.76 -0.46 Pazin 12.18 11.66 -0.52 Zavizan (mountain top) 4.34 3.94 -0.40 Knin 13.62 13.22 -0.40 Mean temperature change: -0.38 °C.