Download
1 / 37
370 likes | 463 Views
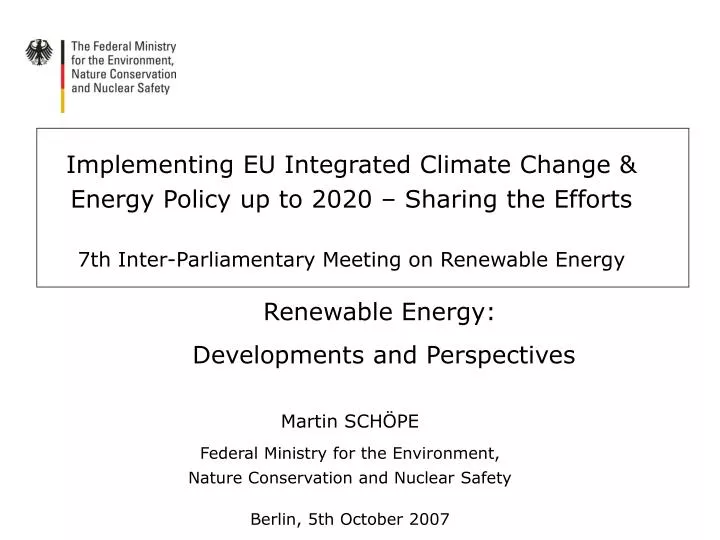
Implementing EU Integrated Climate Change & Energy Policy up to 2020 – Sharing the Efforts 7th Inter-Parliamentary Meeting on Renewable Energy. Martin SCHÖPE Federal Ministry for the Environment, Nature Conservation and Nuclear Safety Berlin, 5th October 2007. Renewable Energy:

E N D
Implementing EU Integrated Climate Change & Energy Policy up to 2020 – Sharing the Efforts7th Inter-Parliamentary Meeting on Renewable Energy Martin SCHÖPE Federal Ministry for the Environment, Nature Conservation and Nuclear Safety Berlin, 5th October 2007 Renewable Energy: Developments and Perspectives
EUROPEAN COUNCIL 2007Historical decision up to 2020: -30/-20% / + 20% / + 20% • Climate change: limit temperature increase to 2°C >-30% GHG emissions / at least -20% GHG • Energy security: reduce import dependence • Competitiveness: innovative industries > 20 % Renewable Energy (2005: 6.5 %) > Saving 20% of EU’s energy consumption
RE development in Germany RE future targets and perspectives in Germany Some elements for the new EU Directive for RE
Priority access for RE to the power grid Priority transmission and distribution Obligation of grid operators to purchase the electricity produced from RE Fixed price (“tariff”) for every kilowatt hour produced from RE for 20 years The Instrument:Feed in Tariff System: EEG (I)
EEG (II) • Equalisation of additional costs for electricity from RE between all grid operators and electricity suppliers • All different types of RE are considered and tariffs are differentiated by source and size of the plant • Annual decrease (-1,5% - -6,5%) due to technical development (degression)
Supports of 2000-2006: Investment grants and loans for 2000- 2006: 827 Mio. € Investment volumes of the promoted measures: 6,5 Billion € Balance of 2006: conveyances: about 160 Mio. € Investment volumes: about 1,6 Billion € The Instrument: The Market Incentive Program (MAP)
Until 31.7.2006 all biofuels were exempted from energy taxation High value of energy tax exemption: - tax rate on diesel fuel: 47 Ct/l - tax rate gasoline: 65 Ct/l Driver for change of support system were tax expenditure losses System change from 1.1.2007 from price regulation (by tax exemption)to quantity regulation (by quota system) Biofuels: Fiscal regulations
Quota on biofuels • quota system starts 1.1.2007 • based on energy content • sub-quotas - remain valid also after 2009 • current share is more than doubled until 2015:
Comprehensive energy and climate change programme(Meseberg, August 2007) Objectives for RE for 2020 Electricity generation: 25-30% EEG continues Heating: 14% Incentives + obligation Biofuels: 17%Quota / Blending RE Target 2020:18-19% (FEC) RE future targets and perspectives
German RE-Electricity Production 1990-2030 Source: EEG-EB, BMU Entwurf, Stand Juni 2007
Additional EEG-Costs 1990-2030 Development of the estimated differential costs and the additional EEG-Costs for households ( per person and month, basis 2007)
Example of Germany, 2006: 5 bn EURO: Lower Wholesale price for electricity 0.9 bn EURO: Savings of Fuel imports 3.4 bn EURO: Avoided damage from climate change and air pollution Benefits of RE
Starting points for EU-Policy RE-Share 2020: 20%! All Member States have to exploit their potentials, all technologies are required New Directive has to be compatible with successful MS policies and instruments No disruption of markets
Additional RES-E penetration 1997 - 2005 Source: Fraunhofer ISI
Policies for the three sectors Biofuels: based on consumption („placing on the market“ through blending / quota obligation) Heating/Cooling: based on production Electricity: based on production Additional consumption element “Compensation”/”Trade”/”Balancing”
“Mandatory” Trade (1) RE producer can sell their GC/GoO to any other market actor or Member State: Phyical RE power has to be integrated in the „exporting“ MS system RE share is counted against the „importing“ MS target
„Mandatory Trade“ (2) Mandatory Trade of GC/GoO destroys Feed-in Tariffs when applicable in parallel Countries with low cost potentials/ technologies will lose that potential Additional costs Case of Germany: ~ 4 Billion €/α 2020 for Germany > Trade ~ 40% more expensive > Loss of public acceptance EU-wide: 100 Billion € up to 2020
“Voluntary” Trade Pending on Government agreement and criteria:(similar to the existing RES-E Directive) >Trade after the national target is reached (interim targets) > time period for the purchase (life time?) > Technology differentiation Compatible with existing national policies
“Balancing Model” Financial Equalisation/Compensation Idea: Equal sharing of the additional costs in all MS MS with strong RE increase receive a compensation (according to the average of the additional costs) MS with slow RE increase participate in the additional costs and benefit in accounting for their target by the amount of financial participation > Separation of RE generation from additional costs (Example: EEG)
Balancing (2): Lowest Costs • Balancing of costs on the basis of a harmonised premium: 15 € / MWh (for all RES-E sources) • corresponds approximately to 1/3 of the total transfer costs • good approximation for the ratio of national and international benefits Example for new RES-E generation in the EU-27 until 2015: Total Payments: 43 bn € ./. 480 TWh (RE) = ca. 9 ct/kWh EU Transfer: 7.2 bn € = ca. 1.5 ct/kWh (=„premium“) 7.2 bn € ./. 3500 TWh (total Power) = ca. 0.2 ct/kWh (add. costs for each consumer)
“Balancing Model” (3) Benefits: Compatible with existing policies in MS Encourages allocation at the best locations Starts immediately This model complies with the internal market rules New EU Agricultural Policy ? NO! Introduce a degression rate
Make (national) instruments strong! Sector targets, interim targets Priority connection for RE - electricity Sustainability criteria for bioenergy Sufficient level of support Streamlining planning procedures Sanctions for non-compliance Essential elements of the new EU RE
Conclusions (1) Balancing Model and „voluntary“ trade with MS agreement can complement existing policies Both can be combined (interim targets) Balancing Model redistributes imediately GC/GoO exchange will start later
Conclusions (2) • Interrelation of RE expansion with GHG reduction policy: • Consideration of RE share within calculation of EU ETS • But separate policy instruments:CO2 price is not sufficient for 20 % RE target
Thank you for your attention ! Together we can make it. The future is promising! Porto 20% 7%