Download
1 / 12
120 likes | 122 Views
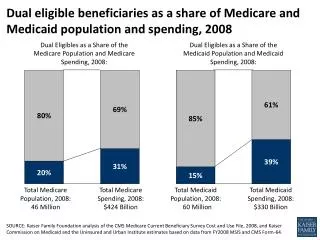
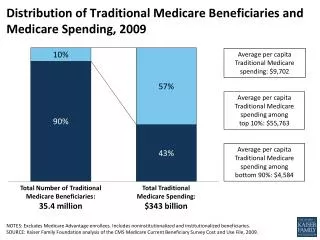
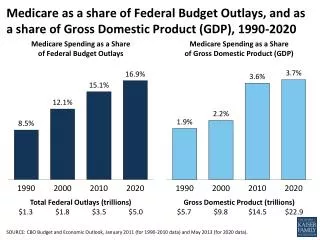
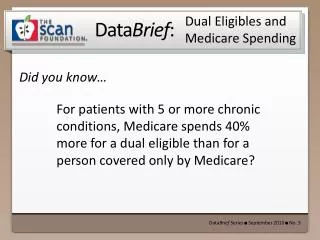
Medicaid and Medicare provide health insurance coverage for more than 3 in 10 Americans. They comprise nearly one-fourth of federal spending and pay for nearly 40% of total health care spending nationwide. This article explores the role of Medicaid and Medicare in providing coverage for different populations and addresses the rising costs of health care.

E N D
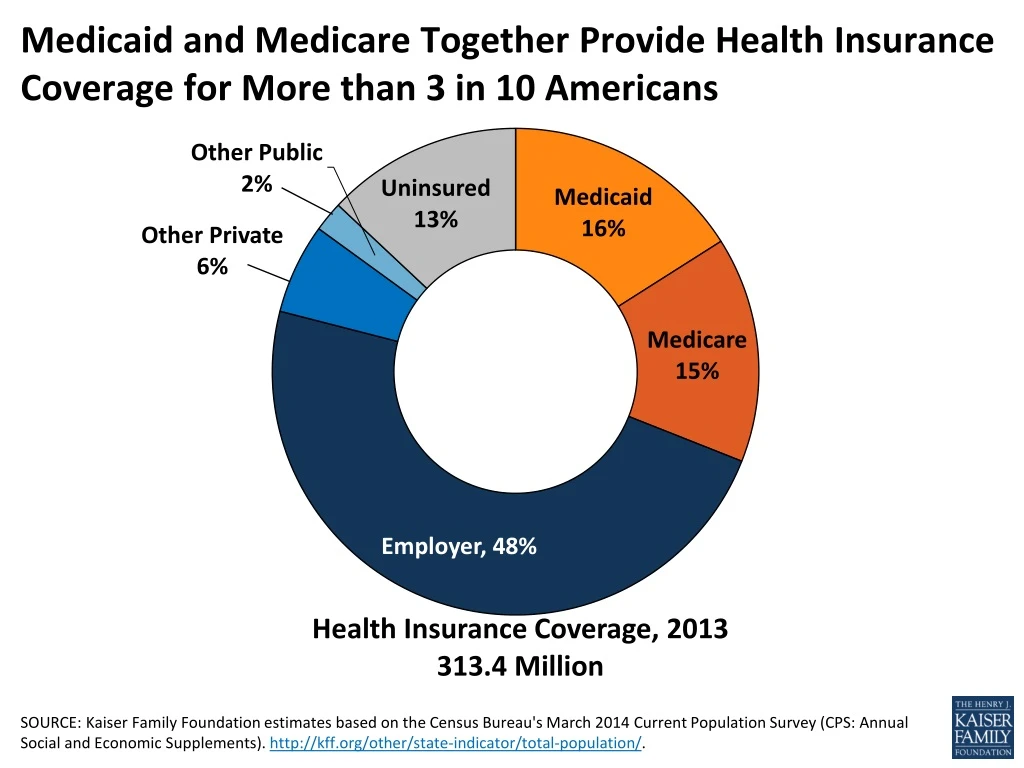
Medicaid and Medicare Together Provide Health Insurance Coverage for More than 3 in 10 Americans SOURCE: Kaiser Family Foundation estimates based on the Census Bureau's March 2014 Current Population Survey (CPS: Annual Social and Economic Supplements). http://kff.org/other/state-indicator/total-population/.
Medicare and Medicaid Comprise Nearly One-Fourth of Federal Spending NOTE: FY is fiscal year. 1 Amount for Medicare is mandatory spending minus income from premiums and other offsetting receipts such as state contribution (clawback) payments to Medicare Part D). 2 ”Other” category includes other mandatory outlays (such as CHIP and Health Insurance Marketplace premium subsidies) minus income from offsetting receipts. SOURCE: Kaiser Family Foundation based on Congressional Budget Office, Budget and Economic Outlook Fiscal Years 2015-2025, January 2015.
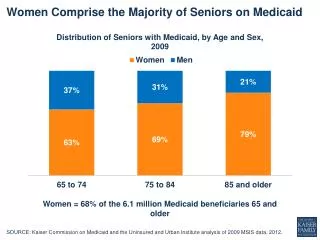
Medicaid’s Role for Selected Populations 1 in 5 Americans <65 1 in 3 children 2 in 3 nursing home residents NOTE: FPL-- Federal Poverty Level. The FPL was $19,530 for a family of three in 2013. SOURCES: Kaiser Commission on Medicaid and the Uninsured (KCMU) and Urban Institute analysis of 2013 CPS/ASEC Supplement; Birth data - Maternal and Child Health Update, National Governors Association, 2012; Medicare data - Medicare Payment Advisory Commission, Data Book: Beneficiaries Dually Eligible for Medicare and Medicaid (January 2015), 2010 data; Functional Limitations - KCMU Analysis of 2012 NHIS data; Nonelderly with HIV - 2009 CDC MMP; Nursing Home Residents - 2012 OSCAR data.
Characteristics of the Medicare Population 1 in 2 Medicare Beneficiaries with incomes < $23,500 1 in 3 Medicare Beneficiaries with 5+ chronic conditions 1 in 4Medicare Beneficiaries reporting fair/poor health status SOURCE: Kaiser Family Foundation analysis of the Medicare Current Beneficiary Survey 2010 Cost and Use file.
Medicare and Medicaid Pay for Nearly 40% of Total Health Care Spending Nationwide NOTE: Includes neither spending on CHIP nor administrative spending. Definition of nursing facility care was revised from previous years and no longer includes residential care facilities for mental retardation, mental health or substance abuse. The nursing facility category includes continuing care retirement communities. SOURCE: CMS, Office of the Actuary, National Health Statistics Group, National Health Expenditure Accounts, 2015. Data for 2013.
Medicare and Medicaid are Projected to Grow at Slower Rates than Private Insurance SOURCE: Calculated based on data published in Projections (Table 17), National Health Expenditure Data. (Centers for Medicare & Medicaid Services, December 2013,) http://www.cms.gov/Research-Statistics-Data-and-Systems/Statistics-Trends-and-Reports/NationalHealthExpendData/NationalHealthAccountsHistorical.html .
Affording the Rising Costs of Health Care Medicare Beneficiaries’ Out of Pocket Costs in 2010 for: NOTE: Analysis excludes beneficiaries enrolled in Medicare Advantage plans. Premiums includes Medicare Parts A and B and other types of health insurance beneficiaries may have (Medigap, employer-sponsored insurance, and other public and private sources).SOURCE: Kaiser Family Foundation analysis of the Medicare Current Beneficiary Survey 2010 Cost and Use file.
The Increasing Role of Private Plans in Medicare Share of Medicare Beneficiaries Enrolled in Medicare Private Health Plans, 1999-2015 Traditional Medicare Medicare Advantage NOTE: Includes MSAs, cost plans, demonstration plans, and Special Needs Plans as well as other Medicare Advantage plans. SOURCE: Authors’ analysis of CMS Medicare Advantage enrollment files, 2008-2015, and MPR, “Tracking Medicare Health and Prescription Drug Plans Monthly Report,” 1999-2007; enrollment numbers from March of the respective year, with the exception of 2006, which is from April.
Financing Care for an Aging Population SOURCE: Kaiser Family Foundation based on the 2014 Annual Report of the Boards of Trustees of the Federal Hospital Insurance and Federal Supplementary Medical Insurance Trust Funds.
Addressing the Coverage Gap in States that Have Not Expanded Medicaid Share of Low-Income Uninsured Adults in the Coverage Gap By State: 3.7 Million Uninsured Low-Income Notes: Excludes legal immigrants who have been in the country for five years or less and immigrants who are undocumented. The poverty level for a family of three in 2015 is $20,090. Totals may not sum to 100% due to rounding. Source: “Number of Poor Uninsured Nonelderly Adults in the ACA Coverage Gap,” KFF State Health Facts. http://kff.org/health-reform/state-indicator/number-of-poor-uninsured-nonelderly-adults-in-the-aca-coverage-gap/#.
The Increasing Role of Managed Care in Medicaid Share of Medicaid Enrollment in comprehensive MCOs: SOURCE: Medicaid Managed Care Enrollment Reports, 2000-2011, CMS.
Meeting the Varied Needs of Populations Covered in Medicaid Source: Kaiser Commission on Medicaid and the Uninsured and Urban Institute estimates based on data from FY 2011 MSIS and CMS-64 reports. Because 2011 data were unavailable, 2010 data was used for Florida, Kansas, Maine, Maryland, Montana, New Mexico, New Jersey, Oklahoma, Texas, and Utah. Data for these 10 states were adjusted to 2010 spending levels.