Download
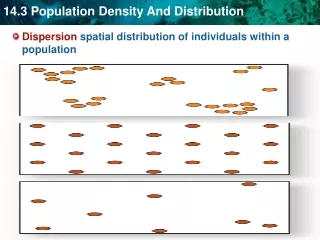
1 / 11
110 likes | 194 Views
Spatial Distribution of Molecules in Damped Ly a Clouds. Hiroyuki Hirashita (Nagoya University, Japan / SISSA, Italy) A. Ferrara, K. Wada, P. Richter. Contents:. H 2 and Dust in DLAs Spatial H 2 Distribution (Theory) Summary. 1. H 2 and Dust in DLAs. Molecular hydrogen (H 2 )

E N D
Spatial Distribution of Molecules in Damped Lya Clouds Hiroyuki Hirashita (Nagoya University, Japan / SISSA, Italy) A. Ferrara, K. Wada, P. Richter
Contents: • H2 and Dust in DLAs • Spatial H2 Distribution (Theory) • Summary
1. H2 and Dust in DLAs • Molecular hydrogen (H2) • The most abundant molecule in the universe: a tracer of cool environments • Molecular clouds are the site of star formation. • Dust • H2 formation takes place. • Shielding of UV and reprocess into IR
Damped Lya cloud Lya absorption QSO > • High H I column density (~1021 cm-2) • High redshift sample with detailed information on ISM. Damped Lya Cloud (DLA) How about H2 and dust?(e.g., Petitjean et al. 2002)
Large scatter Correlation :Dust and H2 in DLAs Ledoux, Petitjean, & Srianand (2003) Correlation between dust abundance and molecular fraction. H2 is not detected. log (molecular fraction) metal depletion log (dust/gas)
How can we explain it? ◆ Strongly inhomogeneous H2 distribution? H2 rich regions Dust poor Dust rich UV background UV background Hard to detect H2 rich regions Large change of H2 detection (with large scatter in abundance)
2. Spatial H2 distribution Hirashita et al. (2003) ◆Numerical calculation (vcir = 100 km/s, zform = 3) Temperature Density 1 kpc
Molecular Fraction Map Included physics on H2: (1) Formation on dust grains (2) Dissociation by UV bg (self-shielding included) (1) = (2) i21 = 0.1, D = 0.1Dsun The H2 distribution is highly inhomogeneous(confined in small clumpy regions). ⇒ Low chance to detectH2 from DLAs
H2 distribution (small scale) 50 pc • H2 rich regions are confined in small regions. • The area with fH2 > 10–6 is only 10% of the surface.
H2 and Dust Random 5 lines of sight through the disc for each dust-to-gas ratio • Overall correlation • Rapid increase of fH2around log (D/Dsun) ~ –1.5. • Large scatter for high D log (molecular fraction) ×: Ledoux et al. (2003) ◆: our simulation log (dust-to-gas ratio)
3. Summary • The paucity of H2 detection for dust-poor DLAs is explained by the small area covered by H2 rich regions. • The correlation betweendust-to-gas ratio and H2 abundance has been explained. • The large variety in H2 fraction for relatively dust-rich DLAs is naturally explained by strong inhomogeneity of H2distribution.


![[ C II ] 158 m m Emission from Damped Ly a Systems](https://cdn1.slideserve.com/3407621/c-ii-158-m-m-emission-from-damped-ly-a-systems-dt.jpg)