Download
1 / 22
220 likes | 401 Views
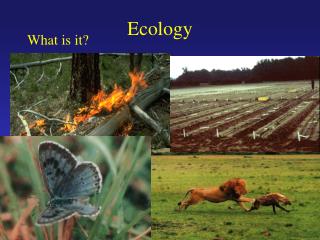
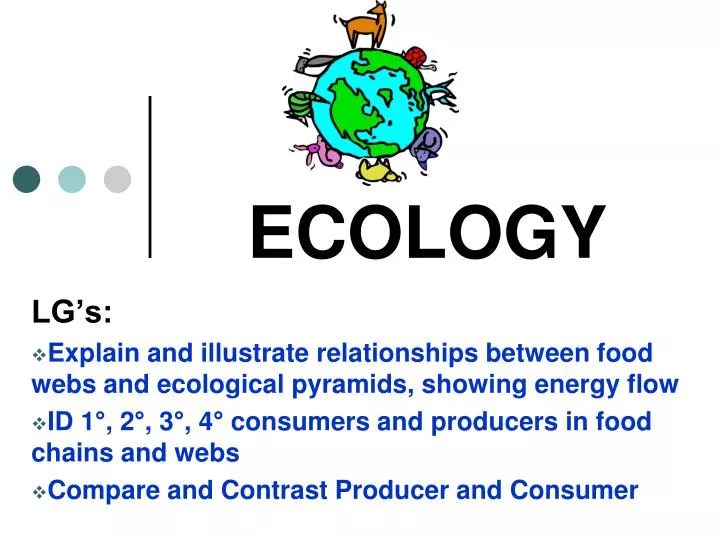
ECOLOGY. LG’s: Explain and illustrate relationships between food webs and ecological pyramids, showing energy flow ID 1°, 2°, 3°, 4° consumers and producers in food chains and webs Compare and Contrast Producer and Consumer . Pakistan. Australia.

E N D
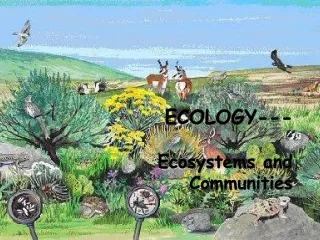
ECOLOGY LG’s: Explain and illustrate relationships between food webs and ecological pyramids, showing energy flow ID 1°, 2°, 3°, 4° consumers and producers in food chains and webs Compare and Contrast Producer and Consumer
Abiotic– non-livingelements in an ecosystem • Air, water, temperature • Biotic– living elements in an ecosystem • Plants, animals, bacteria
PRODUCERS use sunlight/chemicals to make own food/energy AKA: Autotroph CONSUMERS use other organisms for food/energy AKA: Heterotroph COMPARE and CONTRAST
TYPES OF PRODUCERS • Photosynthesis —use sunlight to make carbohydrates (sugars) • Chemosynthesis —use chemicals to make carbohydrates (sugars)
TYPES OF CONSUMERS • HERBIVORES: • energy from only plants • i.e. cows and deer • CARNIVORES: • energy from only animals • i.e. tigers and snakes • OMNIVORES: • energy from both plants and animals • i.e. humans and bears
TYPES OF CONSUMERS • DETRITIVORES: energy from remains of plants and animals • Scavengers • i.e. mites and crabs, • Racoons, vultures, hyenas • DECOMPOSERS: breakdown what the detritivores leave • Fungi(mushrooms), • Bacteria
TROPHIC LEVELS • Energy levels in a food chain or food web • Producers = always first trophic level • Consumers = make up the second, third, etc. trophic levels • Decomposers= feed on every level Grass → Caterpillar → Hawk → Wolf **Arrows represent the energy flow from one organism to the next Producer Primary Consumer Secondary Consumer Tertiary Consumer
FOOD CHAIN • Energy transfer from one organism to another in a series of steps • EXAMPLE: Grass → Caterpillar → Hawk → Wolf • Remember: decomposers feed on every level! Producer Primary Consumer Secondary Consumer Tertiary Consumer
Shows a complex feeding relationship among different animals in an area. Where are the trophic levels in this figure? Flow of Energy Video Clip FOOD WEBS
30 Arrows show energy flow! 20 10
ENERGY PYRAMIDS • Show relative mass, energy, numbers of organisms in each trophic level • Producers are always on the bottom and the most abundant. • Less energy available to the organisms as you go up each trophic level.
ENERGY PYRAMID • ENERGY PYRAMID • Shows the relative amount of energy available in each trophic level
Carnivores and Omnivores Herbivores Producers
Organisms use about 10% of energy from each trophic level • The rest is lost as heat 0.1 1 10 100
Why are there fewer top level consumers than primary consumers on the ecological pyramids? • Examining the pictures and information you have been given, explain your answer.