Download
1 / 16
160 likes | 256 Views
Tidal influence on Antarctic krill in Adélie penguin foraging hot spots. Penguin Foraging Patterns. 10 years of data. Figures courtesy of Matt Oliver. Sampling. Tidal Phase Variability. What we can see with acoustics. Sea floor. http://detlaphiltdic.blogspot.com. Krill Biomass.

E N D
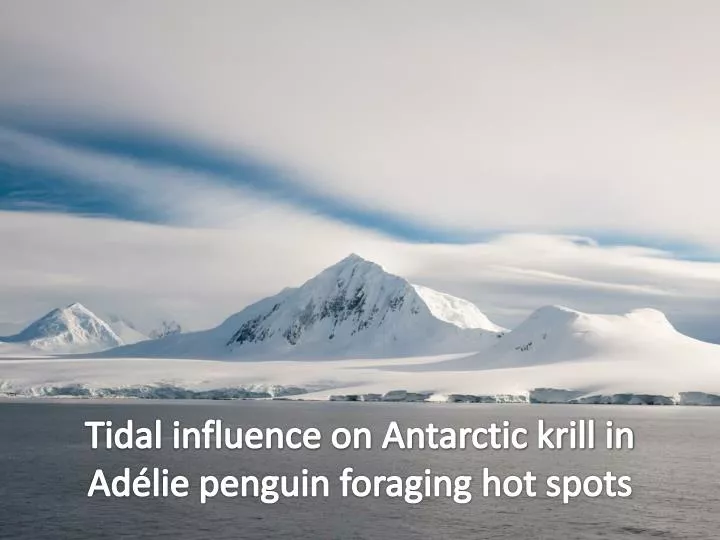
Tidal influence on Antarctic krill in Adélie penguin foraging hot spots
Penguin Foraging Patterns 10 years of data Figures courtesy of Matt Oliver
What we can see with acoustics Sea floor http://detlaphiltdic.blogspot.com
Krill Biomass Krill Biomass • Estimate of weight (grams) of krill through water column at a single point • Averaged over survey grid for each day = mean daily krill biomass
Krill Aggregations Krill Aggregations For each aggregation we calculate: Mean depth, dimensions (L, H), nearest neighbor distance Volumetric abundance and biomass (ind. m-3 and g m-3) Aggregation-specific integrated biomass (g m-2) Biomass encounter rate (kg m-1)
Mean Daily Krill Biomass Error bars are 2 standard errors
Optimal Foraging andKrill Aggregation Structure • Central place foraging • Minimize foraging time • Maximize energy intake • Krill aggregation structure impacts foraging efficiency • Depth, size, densities and distance to next aggregation are important
Variability in Aggregation Structure Palmer Deep • Shallow • Large • Further apart • Less dense • Low biomass encounter rate Diurnal Tide Semi-Diurnal Tide Deep Small Further apart More dense Low biomass encounter rate • Shallow • Large • Closer together • More dense • Highest biomass encounter rate
Summary…and more questions • Nearshore Antarctic krill distribution patterns are highly variable • Tide plays a role - but how? • Aggregation structure seems to be affected by tide and has an impact on penguin foraging, but to what degree? • What types of aggregations are penguins going after?
Pilot Field SeasonPalmer 2013-2014 • Two acoustic grids within the Palmer Station boating limits: • East Grid (~13 nm, 23 km) • West Grid (~12 nm, 22 km) • Traveling at ~3-4 knots = 6-8 hours • Sampling as frequently as possible • Predator observations from the water – species identification, behavior