Download
1 / 10
100 likes | 204 Views
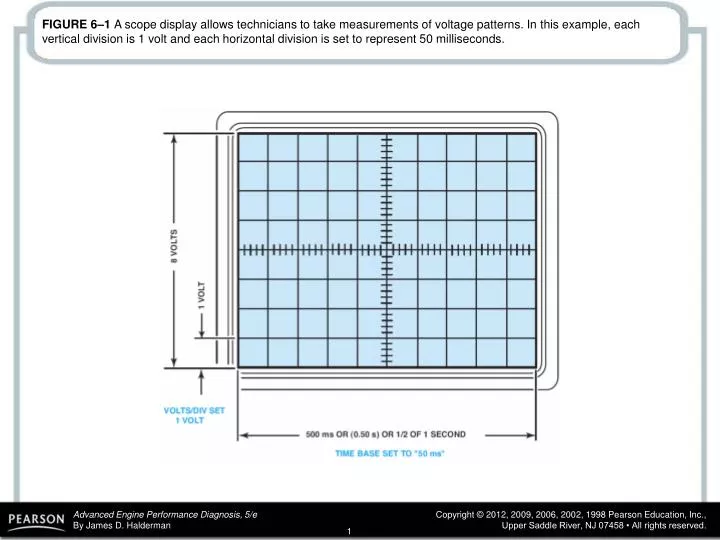
FIGURE 6–1 A scope display allows technicians to take measurements of voltage patterns. In this example, each vertical division is 1 volt and each horizontal division is set to represent 50 milliseconds.

E N D
FIGURE 6–1 A scope display allows technicians to take measurements of voltage patterns. In this example, each vertical division is 1 volt and each horizontal division is set to represent 50 milliseconds.
FIGURE 6–2 The display on a digital storage oscilloscope (DSO) displays the entire waveform from idle to wide-open throttle and then returns to idle. The display also indicates the maximum reading (4.72 V) and the minimum (680 mV or 0.68 V). The display does not show anything until the throttle is opened, because the scope has been set up to only start displaying a waveform after a certain voltage level has been reached. This voltage is called the trigger or trigger point.
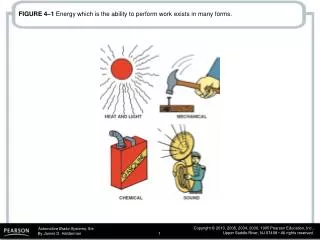
FIGURE 6–3 Ripple voltage is created from the AC voltage from an alternator. Some AC ripple voltage is normal but if the AC portion exceeds 0.5 volt, then a bad diode is the most likely cause. Excessive AC ripple can cause many electrical and electronic devices to work incorrectly.
FIGURE 6–4 A pulse train is any electrical signal that turns on and off, or goes high and low in a series of pulses. Ignition module and fuel-injector pulses are examples of a pulse train signal.
FIGURE 6–5 (a) A scope representation of a complete cycle showing both on-time and off-time. (b) A meter display indicating the on-time duty cycle in a percentage (%). Note the trigger and negative (-) symbol. This indicates that the meter started to record the percentage of on-time when the voltage dropped (start of on-time).
FIGURE 6–6 Most automotive computer systems control the device by opening and closing the ground to the component.
FIGURE 6–7 A two-channel scope being used to compare two signals on the same vehicle.
FIGURE 6–8 (a) A symbol for a positive trigger—a trigger occurs at a rising (positive) edge of the signal (waveform). (b) A symbol for a negative trigger—a trigger occurs at a falling (negative) edge of the signal (waveform).
FIGURE 6–9 Battery voltage is represented by a flat horizontal line. In this example, the engine was started and the battery voltage dropped to about 10 V as shown on the left side of the scope display. When the engine started, the alternator started to charge the battery and the voltage is shown as climbing.
FIGURE 6–10 A typical graphing multimeter that can be used as a digital meter, plus it can display the voltage levels on the display screen.