Download
1 / 1

E N D
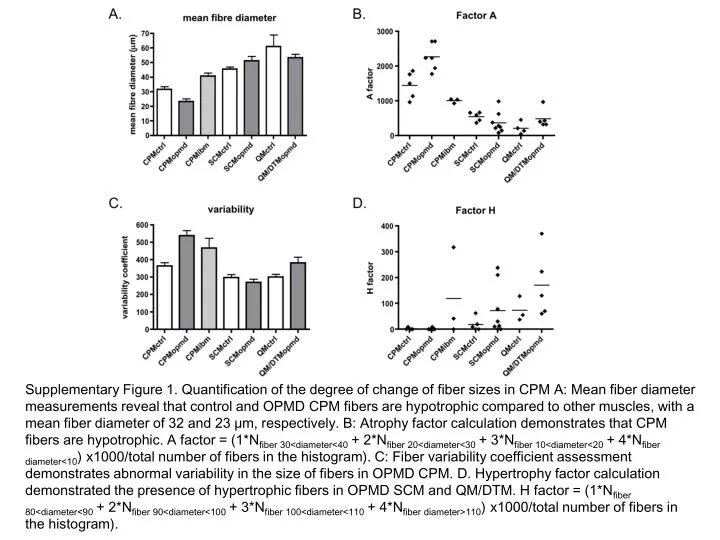
Supplementary Figure 1. Quantification of the degree of change of fiber sizes in CPM A: Mean fiber diameter measurements reveal that control and OPMD CPM fibers are hypotrophic compared to other muscles, with a mean fiber diameter of 32 and 23 μm, respectively. B: Atrophy factor calculation demonstrates that CPM fibers are hypotrophic. A factor = (1*Nfiber 30<diameter<40 + 2*Nfiber 20<diameter<30 + 3*Nfiber 10<diameter<20 + 4*Nfiber diameter<10) x1000/total number of fibers in the histogram). C: Fiber variability coefficient assessment demonstrates abnormal variability in the size of fibers in OPMD CPM. D. Hypertrophy factor calculation demonstrated the presence of hypertrophic fibers in OPMD SCM and QM/DTM. H factor = (1*Nfiber 80<diameter<90 + 2*Nfiber 90<diameter<100 + 3*Nfiber 100<diameter<110 + 4*Nfiber diameter>110) x1000/total number of fibers in the histogram).