Download
1 / 24
240 likes | 344 Views
. Pensions policy context Evidence gaps to fillDevelopment and progress so farFuture plans potential DWP uses for the Wealth and Assets Survey. Pensions policy context . DWP Green paper on pensions December 2002Pensions Commission reports October 2004 and November 2005DWP White Paper Securit

E N D
1. Note change of anem for the filed � we do not actually have 2 separate surveys!Note change of anem for the filed � we do not actually have 2 separate surveys!
2. Pensions policy context
Evidence gaps to fill
Development and progress so far
Future plans � potential DWP uses for the Wealth and Assets Survey Intro � want to say have only recently become involved in this project (last couple of months) so not familiar with all of the detailed development work that went into this survey.
The survey details included here have been provided by colleagues at ONS.Intro � want to say have only recently become involved in this project (last couple of months) so not familiar with all of the detailed development work that went into this survey.
The survey details included here have been provided by colleagues at ONS.
3. Pensions policy context DWP Green paper on pensions December 2002
Pensions Commission reports October 2004 and November 2005
DWP White Paper �Security in retirement: towards a new pensions system� May 2006
DWP White Paper Autumn 2006 My interest in DWP is particularly pensions so this is the element of HAS that I will be focusing on, and how DWP hope to use the data in future.
In recent years pensions policy has moved up the agenda in terms of a priority in the UK.
Note various undersaving estimates with these publicationsMy interest in DWP is particularly pensions so this is the element of HAS that I will be focusing on, and how DWP hope to use the data in future.
In recent years pensions policy has moved up the agenda in terms of a priority in the UK.
Note various undersaving estimates with these publications
4. Estimates of undersaving DWP�s analysis in 2002 suggested up to 3 million people were seriously undersaving for their retirement (or planning to retire too early), and a further 5 to 10 million people ought to consider saving more and/or working longer, depending on their expectations for retirement.
The Pensions Commission�s first report estimated that between 9.6 and 12 million people are not saving enough for retirement.
Recent DWP analysis using the 2002 English Longitudinal Study of Ageing, and based on IFS analysis, suggests at least 7 million people are undersaving for retirement.
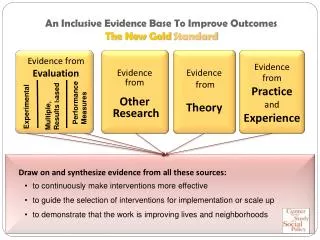
5. The adequacy of retirement saving among people aged between 50 and State Pension age: proportion who are not saving enough This an example of some analysis which was done by the Institute for Fiscal Studies using data from the English Longitudinal Study of Ageing, or ELSA. ELSA is a multi-topic longitudinal survey of around 12,000 people aged 50 and over which, like HAS, follows up respondents every two years.
This slide shows an important application of survey information on wealth on assets, which is to determine the extent to which people are saving enough for their retirement.
The bar on the left hand side shows, that if we assume that people will fund their retirement only using pension income, 3 in 10 people have inadequate resources.
The bar on the far right shows, that if we assume that people use all assets available to them in retirement, including anticipated inheritances, and half of the wealth from their houses, just over one in 10 people will have inadequate resources.
These are people who might have a retirement income that does not provide for their reasonable expectations of quality of life.
These statistics were published in the recent White Paper on the pensions system. We plan to carry out similar analysis using HAS to examine retirement saving among the entire working age population, because these statistics only cover people aged 50 to SPA. In addition, longitudinal data in HAS will help us to answer questions about what sources of wealth will be used to fund people�s retirement.
The results published in the White Paper were used to inform decisions about the way to encourage people to save more for their retirement. Information from HAS will be important to evaluate the success of changes to policy.
This an example of some analysis which was done by the Institute for Fiscal Studies using data from the English Longitudinal Study of Ageing, or ELSA. ELSA is a multi-topic longitudinal survey of around 12,000 people aged 50 and over which, like HAS, follows up respondents every two years.
This slide shows an important application of survey information on wealth on assets, which is to determine the extent to which people are saving enough for their retirement.
The bar on the left hand side shows, that if we assume that people will fund their retirement only using pension income, 3 in 10 people have inadequate resources.
The bar on the far right shows, that if we assume that people use all assets available to them in retirement, including anticipated inheritances, and half of the wealth from their houses, just over one in 10 people will have inadequate resources.
These are people who might have a retirement income that does not provide for their reasonable expectations of quality of life.
These statistics were published in the recent White Paper on the pensions system. We plan to carry out similar analysis using HAS to examine retirement saving among the entire working age population, because these statistics only cover people aged 50 to SPA. In addition, longitudinal data in HAS will help us to answer questions about what sources of wealth will be used to fund people�s retirement.
The results published in the White Paper were used to inform decisions about the way to encourage people to save more for their retirement. Information from HAS will be important to evaluate the success of changes to policy.
6. �Security in retirement: towards a new pensions system� In 2012 we will introduce a new scheme of personal accounts with automatic enrolment which will provide a straightforward opportunity to contribute to a high-quality, low-cost savings vehicle.
In order to make the system of personal accounts more effective, we will provide a solid foundation on which people can save. To achieve this, we will reform state pensions so that they are simpler and more generous, and will ensure that pensioners share in rising national prosperity.
From 2010 we will make the state pension fairer and more widely available.
We will support and encourage extended working lives.
We will streamline the regulatory environment. So the First WP in May outlined the Government�s proposals for pensions reform, both in the state and private sectors.
This week the Government has published its second WP in this area focusing in more detail on the development of the personal accounts system.So the First WP in May outlined the Government�s proposals for pensions reform, both in the state and private sectors.
This week the Government has published its second WP in this area focusing in more detail on the development of the personal accounts system.
7. Evidence gaps to fill To inform policy development
To monitor the impact of planned reform
So required comprehensive longitudinal information base on wider assets and savings, leading to
more complete information on savings behaviour through time, and individual needs across the age spectrum, and
a better understanding of lifetime earnings and savings decisions
So developed Wealth and Assets Survey
8. A new cross-departmental survey of wealth Key driver is the need for information on savings for retirement
Most comprehensive data source on household assets and debts
Panel design � tracking changes in assets and debts, and reasons behind such changes
Wider scope is a statistical system linking the survey to data from other sources (administrative data from HMRC, DWP)
Note consortium approach � DWP, ONS, DTI, HMRC and othersNote consortium approach � DWP, ONS, DTI, HMRC and others
9. Progress so far Discussions with departments since 2003
Three stage approach:
Feasibility (June 2005)
Pilot (Jan/Feb 2006)
Main stage fieldwork (started July 2006)
10. Survey design: questionnaire (1) Assets
Accounts and investments
Pension schemes
Property, household goods, vehicles
Business assets
Trusts
Children�s savings
Debts
Mortgages and loans secured on main residence
Equity release
Credit and store cards, hire purchase, loans
Arrears on household bills and other payments
Hopefully can skip through these details � people should be familiar with the content of wealth surveys?
But trying to be comprehensive � note importance of private pensions in UK context.Hopefully can skip through these details � people should be familiar with the content of wealth surveys?
But trying to be comprehensive � note importance of private pensions in UK context.
11. Survey design: questionnaire (2) Income
Earnings, benefits, pensions, other regular income
Inheritances, lifetime gifts, other lump sums
Behaviours and attitudes
Saving and borrowing
Saving for retirement, pension sources
Financial management, expectations
Attitudes to risk
Classificatory
Household composition, ethnicity, tenure
Economic activity and education
Health and caring
As well as value of assets etc also collecting info on attitudes etcAs well as value of assets etc also collecting info on attitudes etc
12. Survey design: sample (1) Two-stage sample of addresses
Regional and census-based stratification at first stage
Set sample of 26 addresses per Primary Sampling Unit
Achieved 32,000 households at wave one
Spread over two years: July 2006 to June 2008
Addresses likely to be wealthier sampled at higher rate
All responding households re-interviewed at wave two after two-year gap
�10 incentive
Sub-sample of 1,500 households most in debt re-interviewed after one year
Note: DTI interest in debt issues Note: DTI interest in debt issues
13. Survey design: sample (2) Stratification
Regional for precise regional estimates
NS-SEC and car ownership census-based variables (used on Expenditure and Food Survey and Family Resources Survey)
Estimated precision of change for age groups
Design factors and correlations modelled from British Household Panel Survey
Average minimum significant observed change
Design over time
Slow change in savings and investments
Short-term changes in debt for those most in debt
14. Over-sampling wealthier households More precise analysis of wealthier households
Improve precision of total and means
Savings and assets have highly skewed distributions
Self-assessment tax data - HMRC
Individuals with high (taxable) income from wealth
Match addresses with individuals with higher imputed wealth
Sample flagged addresses at twice rate of others
Maintain fixed 26 addresses per Primary Sampling Unit
15. Challenges and opportunities (1) An ambitious survey�..
Challenging questionnaire content
Questionnaire length issues
Data linking � administrative data (DWP, HMRC)
Longitudinal design
2 year gap
2 year gap �issues re keeping in touch strategy etc2 year gap �issues re keeping in touch strategy etc
16. Challenges and opportunities (2) But�.
Rich data source
Longitudinal and cross-sectional
Strong information needs for policy
Learning opportunities
Longitudinal design and analysis
Data linking � use of administrative data
17. Where are we now? Since fieldwork started in July �
Response rates have been in line with expectations
Good consent rates so far for wave 2 interviews, and for data linking
So a good start that we hope will continue for the rest of fieldwork period
18. Next steps Consortium members should receive first quarterly dataset to look at in March 2007
Develop editing strategy, validation, imputation, derived variables, quality assurance � starting now and will continue through 2007, 2008
Start to develop data linkage to administrative data from end 2007
Full analytical report on wave 1 expected to be published early 2009 by ONS
19. ANIMATED SLIDE, 3 CLICKS NEEDEDANIMATED SLIDE, 3 CLICKS NEEDED
20. DWP uses for the Wealth and Assets Survey (1) No idea of exact number of under savers and their characteristics
Difficult to predict expenditure and manage budget (c.�50bn pensioner benefits)
Difficult to target help at those who need it most
Difficult to produce robust policies that will address the problem if we don�t know how big the problem is
21. DWP uses for the Wealth and Assets Survey (2) When we reform the pension system we need to know
What amount of risk people would be comfortable with
Who they would trust to provide pensions for them/provide advice
If they would be happy to use their housing to fund retirement
Important for us to know about all types of wealth
People choose to save in different ways
Need to know why they are saving or not and the degree to which they expect to use other forms of wealth to fund them in retirement
22. DWP uses for the Wealth and Assets Survey (3) When do people start saving?
Why do they stop saving?
Panel data should be able to pick up changes in circumstances and how these affect (pension) saving
Do savings increase over time, or are they short term and spent?
If people say they want to save more do they? What stops them?
We can estimate everyday expenditure, but useful to get feel for large expenditures which might stop saving, or which might reduce at retirement
Income and benefits critical to understand if people have enough money to save/stay out of debt.
23. DWP Employer follow-up survey Pensions are complex. People�s knowledge and awareness of pensions can be patchy, e.g.
Scheme joining mechanisms
Eligibility criteria
Balance of employee vs. employer contributions
Linked data from employers will help us to:
Collect complex/specialised information
Validate survey responses
Gauge awareness of employer schemes
Understand �pension journeys�
ON top of the main survey 2 additional elements where we hope to enhance the results and usefulness of the data.
As a survey of individuals within households, HAS relies heavily on self-reporting, respondents� levels of knowledge and awareness, and their recall ability.
In the field of pensions this raises questions about the accuracy of recorded data, as many people�s knowledge of pensions is patchy, particularly on the details of pension schemes. Accurate information on, for example, joining mechanisms, eligibility criteria, employer and employee contributions are important in explaining why people do, or do not, join schemes.
We intend to link data from HAS respondents� employers by conducting an employer follow-up survey.
This is this reason why we ask for people to give us details of their employer.
However, note that employer can choose whether or not they take part in the survey.
We will not be sending individuals� survey responses to employers
This will create a powerful source of information on employer pensions that will link factual information from employers with HAS self-reported pensions information.
This combination of sources will enable us to validate what is reported by respondents. It could also help us to improve the questions we ask if it seems that many people are not understanding a question.
Information from employer will also be useful for assessing people�s awareness of schemes provided by their employer. For example, we can assess the extent to which people are aware of the amount their employer contributes to their pension.
As we collect employer details from all respondents who are employees, even if they are not a member of an employer pension scheme, it will be possible to understand what types of scheme people aren�t joining.
Finally, employer data will help us to understand individuals� pension journeys as they move jobs. For example whether they choose to transfer and consolidate pensions when they change employment. Combining the individual and employer specific information, will add to our understanding of the factors that affect these decisions.
So plan to have a feasibility study in early 2008 to see if we are able to contact employers and receive data from them. ON top of the main survey 2 additional elements where we hope to enhance the results and usefulness of the data.
As a survey of individuals within households, HAS relies heavily on self-reporting, respondents� levels of knowledge and awareness, and their recall ability.
In the field of pensions this raises questions about the accuracy of recorded data, as many people�s knowledge of pensions is patchy, particularly on the details of pension schemes. Accurate information on, for example, joining mechanisms, eligibility criteria, employer and employee contributions are important in explaining why people do, or do not, join schemes.
We intend to link data from HAS respondents� employers by conducting an employer follow-up survey.
This is this reason why we ask for people to give us details of their employer.
However, note that employer can choose whether or not they take part in the survey.
We will not be sending individuals� survey responses to employers
This will create a powerful source of information on employer pensions that will link factual information from employers with HAS self-reported pensions information.
This combination of sources will enable us to validate what is reported by respondents. It could also help us to improve the questions we ask if it seems that many people are not understanding a question.
Information from employer will also be useful for assessing people�s awareness of schemes provided by their employer. For example, we can assess the extent to which people are aware of the amount their employer contributes to their pension.
As we collect employer details from all respondents who are employees, even if they are not a member of an employer pension scheme, it will be possible to understand what types of scheme people aren�t joining.
Finally, employer data will help us to understand individuals� pension journeys as they move jobs. For example whether they choose to transfer and consolidate pensions when they change employment. Combining the individual and employer specific information, will add to our understanding of the factors that affect these decisions.
So plan to have a feasibility study in early 2008 to see if we are able to contact employers and receive data from them.
24. DWP Linking administrative data Respondents may not recall information (correctly)
People do not know the answer to some questions
Respondent burden - interview length is limited
Benefits of linked data include:
Cost-effective (e.g. more time to ask attitudinal questions)
Opportunities to validate respondents� responses (e.g. benefit receipt)
Inclusion of additional time points (e.g. historical National Insurance records)
Respondents may not remember information at all, or if they do, they may not remember it correctly (for example, they may not know the percentage of their salary that their employer contributes to their pension)
There is some information which that we cannot expect people to know, which is very important for examining people�s wealth. For example, NI contributions.
Linking data will also save time, and reduce the burden on survey participants.
Then benefits from slide�
25. Examples of the use of linked data Who is eligible for Pension Credit but not receiving the benefit?
Can assess entitlement from survey responses
Examine who reports receipt of Pension Credit in the survey and validate answers with linked data.
Fill in �Don�t Knows� with linked data
Policy relevance: Understanding how best to encourage benefit take-up
Which types of people do not build up entitlement to a full Basic State Pension?
Need full National Insurance contribution history
Understanding is enhanced by range of information on social/household characteristics in Wealth and Assets Survey
Policy relevance: Provides evidence to evaluate recent proposals on number of years needed to qualify for Basic State Pension
Pension Credit is a means-tested benefit for pensioners in the UKPension Credit is a means-tested benefit for pensioners in the UK