Download
1 / 13
130 likes | 255 Views
2001. Oct. 1998. 2008. July 2009. Bob Taylor, Dartmouth NS. Monitoring Shoreline Change Geological Survey of Canada, Atlantic (GSCA). Historical framework .........for examining shoreline change in the Gulf of St Lawrence. Geogr. Branch. 1959, Gosselin, 1972, LRIS, 1988. (12 sites).

E N D
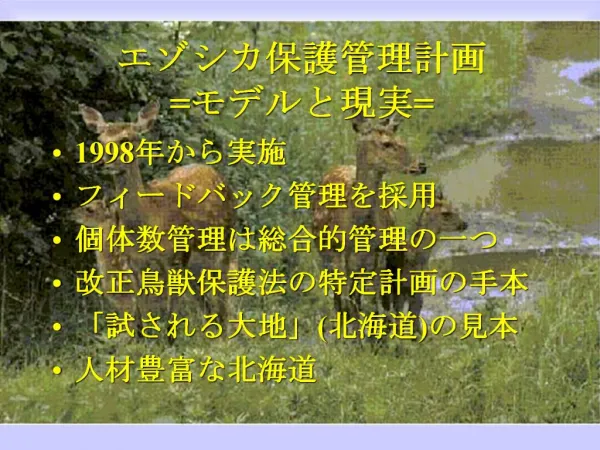
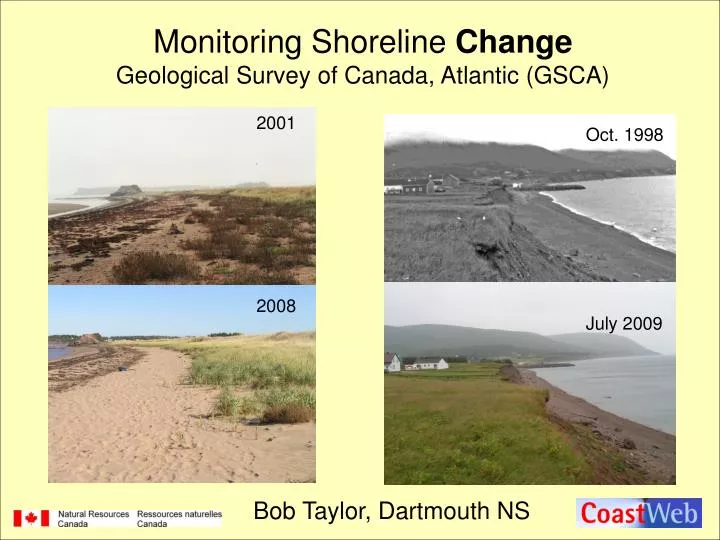
2001 Oct. 1998 2008 July 2009 Bob Taylor, Dartmouth NS Monitoring Shoreline ChangeGeological Survey of Canada, Atlantic (GSCA)
Historical framework .........for examining shoreline change in the Gulf of St Lawrence Geogr. Branch. 1959, Gosselin, 1972, LRIS, 1988
(12 sites) (10 sites) (5 sites ) Shoreline sites Monitored by GSCA 302 sites Atlantic Canada 27 sites in Southern Gulf Time frame: Shore measurements 1980-2006 Aerial video surveys: 1984-2000
Objectives: repetitive survey and photographic measurements at representative shore sites • Develop a baseline / index of “typical” types and rates of shoreline change ..........for future comparison. • Define natural phases and duration of shoreline change, ie. erosion, stability and accretion. • Document impact of storms and shoreline resilience to these events. (flooding, landward migration). • Document human activities and impacts on shoreline stability. http://gsc.nrcan.gc.ca/coast/index_e.php
Waterside Beach NS Storm Impacts: wave runup, dune erosion (Dec. 2004) dune ridges 2008 2001 Dune Building Phase 1981-2008 1981 High tide level ocean
Top Cliff Retreat 1981-2009: glacial deposits only vs on rock Geogr. Branch: (1930s-1960) 0.18 to 0.4m/yr Gosselin: (1930s-1970) 0.15 to 0.6m/yr
1983 Belfry Beach, Cape Breton Island 2009 Long -Term Beach Recovery from commercial sediment extraction
1945 - 2003 Shore cliff ocean Field Measurements vs Remote Sensing New technology –larger areas covered but may not include local area suitable for rock shores provides a rate of net change over set time intervals Misses interim period and timing of changes Similar mean rates of retreat 0.4 m/yr yet variable over time –max rate?
People often perceive shoreline erosion as much greater than it is in reality (long term) • - result of negative media and people see the worst in crisis situations -demand remedial action immediately . • - shorelines can respond and repair themselves naturally. 2. Decisions about shoreline repairs are often made at time of crisis, no time for consultation of monitoring results. -plans should be made earlier in a proactive mode. 3. News is short (days to months +anniv), Memory is longer (10-15 yrs); and Interest is cyclic (25-30 yrs). Thoughts for Discussion
1. In past - Field monitoring lasted months to ~ 3 years, (university or community) continuity often broken and information not archived nor easily accessible in time. 2. There is no one agency monitoring and archiving long term shoreline changes (physical) and no long term baseline references to evaluate magnitude of shoreline responses. Photo C. Currie More Thoughts for Discussion
3. No one agency assessing the impacts of shore protection structures which would improve future decisions and advice. -Different attitudes to shore protection structures evolve with time, eg, groynes. -scale of human activity at coast unanticipated. Photo EAC 4. GIS and GPS technology and satellite remote sensing will be the way of the future but need to maintain the "feel" and understanding of why shoreline changes are occurring. -Shediac and Clyde River examples Even More...........
1. Establish key locations (and maintain shoreline markers) for repetitive surveys. Community Strength - local knowledge & drive. Document local conditions pertinent to their geographic area 2. Log date of storm events –flood levels and extent from rivers, waves or storm sewers. 3. Photo, mark and log:- wave run-up limits, dune and cliff retreat, washover channels cut into dunes, opening and closing of tidal channels. 4. Repetitive photos from established locations -at set interval and after storms (need same person / camera specs used).
Alert provincial/ federal agencies about physical changes and need to resurvey. Lobby for support and results. . 5. Note significant changes in vegetation limits, sediment levels at structures or human infrastructure in shore zone. Community Strength – proximity & concern