Download
1 / 17
170 likes | 314 Views
JHT Project: Evaluation and Improvement of Ocean Model Parameterizations for NCEP Operations. L. K. Shay, G. Halliwell, J.Brewster, B. Jaimes, C. Lozano, W. Teague MPO, RSMAS, Univ. of Miami EMC-NCEP Oceanography Department, NRL-Stennis http://isotherm.rsmas.miami.edu/~nick. Outline:.

E N D
JHT Project: Evaluation and Improvement of Ocean Model Parameterizations for NCEP Operations L. K. Shay, G. Halliwell, J.Brewster, B. Jaimes, C. Lozano, W. Teague MPO, RSMAS, Univ. of Miami EMC-NCEP Oceanography Department, NRL-Stennis http://isotherm.rsmas.miami.edu/~nick
Outline: • Oceanic Response Features • Cold and Warm Core Eddies -Ivan (04) • Loop Current/Warm Core Eddy Interactions (deep OML) • 1. Katrina and Rita (05) • 2. Gustav and Ike (08) • 2010 HFP with NOAA IFEX/MMS/NASA/NSF • Summary • Recurrent Theme: • 3-D Upper ocean observations are critical in understanding • the response and interactions with atmosphere.
Integrated thermal structure (OHC) and vertical current shear. Current and shear central for mixing, cooling and, feedback to the storm. Changing ocean mixed layer depths affect feedback to the TC boundary layer. 16 126 kJ cm-2 Leipper and Volgenau (JPO, 1972)
Ivan’s Track and Intensity Relative to OHC (left) NRL SEED Mooring Locations in Northern Gulf of Mexico Relative to Bottom Depth (Right) (Teague et al., JPO, 2007). 14 ADCP moorings- Focus here in Array 9.
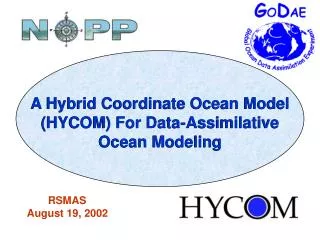
MOTIVATION: Ivan (2004) over the GOM SSH (cm) from HYCOM (from Halliwell et al., MWR, 2008). SST Analyses Northern Cyclone Southern Cyclone
HYbrid Coordinate Ocean Model (HYCOM)Hurricane Ivan Simulations 10 Sept-6 Oct 04 (Halliwell et al., 2010) • Configuration: • 0.04° Mercator grid, Gulf of Mexico domain • No data assimilation performed • Initial and boundary conditions from U.S. Navy HYCOM ocean nowcast-forecast system: • Data assimilative ocean nowcast • Navy Coupled Ocean Data Assimilation (NCODA) assimilation • Atmospheric Forcing: • Navy 27 km COAMPS atmospheric model • Vector wind blended with higher resolution fields from HWIND • Wind stress for HWIND calculated using Donelan cd
Observed/Simulated Current Response at M9 (1.5 Rmax) from 7 Experiments Halliwell et al., MWR, (2009) Below cd using ocean response as a tracer in Shay and Jacob (2006)
Current Time Series Comparisons @ 1.5 Rmax U (east-west) V (north-south)
Vertical Mixing Observed Conclusion: KPP mixing produces the most realistic shear response. Other two choices under- estimate entrainment, which reduces mixed layer deepening and SST cooling. KPP (control) Mellor-Yamada GISS
Difference in SST cooling GISS minus KPP mixing
Drag Coeff. Parameterization Observed Conclusion: parameter- izations that yield coefficients between 2 x 10⁻³ and 2.5 x 10⁻³ at high wind speeds produce the most realistic shear response. Larger (smaller) coefficient Values increase (decrease) mixed layer deepening and SST cooling Powell et al. Donelan et al. (control) Large and Pond
The 2005 Loop Current System experiment twice the radius of maximum winds • Seawater temperature and conductivity data from four airborne surveys. • Mooring data: velocity, temperature, and conductivity at ~10 m intervals. Moorings CCE2 For the first time, the ocean response to major hurricanes was simultaneously measured inside cyclonic and anticyclonic geostrophic features. LC WCE CCE1
TC-induced cooling in geostrophic eddies (airborne data) CCE: T ~ -4.5oC Loop Current bulge: T ~ -1oC 26oC 26oC cluster-averaged temperature profiles (Hurricane Rita) Jaimes and Shay, MWR, 2009
Track and Intensity of TC’s Gustav and Ike Versus AXBTs relative to OHC and 26oC Isotherm Depth. Gustav : 191 AXBTs 111 GPS Drifters Floats Ike : 216 AXBTs 111 GPS Drifters Floats SMFR, SRA measurements.
Progress Summary and Blueprint For Future Ivan a clear example of negative feedback(wake cooling/mixing induced by strong winds and Cold Core Ring) as opposed to positive feedback over the Loop Current and Warm Core Rings. Relative to the moored ocean measurements: • Simulated shear response is a stringent test of model performance • KPP mixing outperforms Mellor-Yamada and GISS • Drag coefficient parameterizations that yield values between 2.0 x 10⁻³ and 2.6 x 10⁻³ (e.g. Donelanet al.) outperform those that yield larger or smaller values • No need to use vertical resolution of < 10 m with KPP mixing • Same conclusions realized at other SEED moorings (not shown) • Model evaluation must be extended to other storms and to differing ocean regions (Katrina and Rita (05); Frances (04); Gustav and Ike (08) • High quality ocean observations are critically important for model evaluations (e.g., NOAA IFEX, MMS, NASA GRIP this summer)
NOAA WP-3D profiling over MMS Moorings (IFEX, NASA GRIP) Deliverables include: V, T, S profiles to 1000 m @ 2-m resolution. Surface winds (SFMR, GPS) provided by HRD. Atmospheric profiles of V, T and RH @ 5-m resolution. Expendables deployed from P-3 and proposed moorings relative to the LC, WCE and CCE superposed on late Sept 05 altimetry derived 26oC isotherm Depth (After Rita).