Download
1 / 51
510 likes | 663 Views
Precipitation growth (Ch. 9, last section). Coalescence vs. ice crystal process Which produces a faster growth? Diffusional growth to precipitation size is possible for ice crystals, but not for water drops. **Need collection processes to get water to precip sizes

E N D
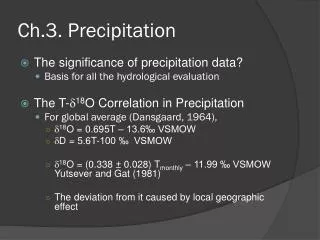
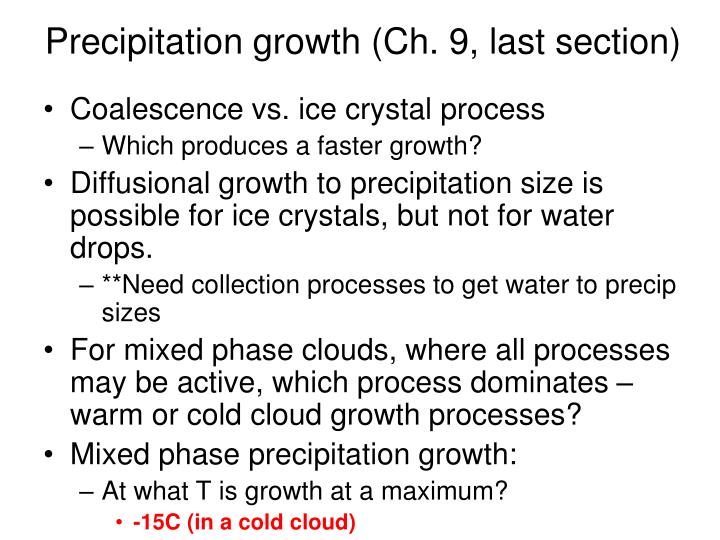
Precipitation growth (Ch. 9, last section) • Coalescence vs. ice crystal process • Which produces a faster growth? • Diffusional growth to precipitation size is possible for ice crystals, but not for water drops. • **Need collection processes to get water to precip sizes • For mixed phase clouds, where all processes may be active, which process dominates – warm or cold cloud growth processes? • Mixed phase precipitation growth: • At what T is growth at a maximum? • -15C (in a cold cloud)
Fig. 9.8 from R&Y: example calculations showing relative growth times for ice crystal and water droplet • Assumptions: • Ice crystal: • - stellar dendrite, C = 2r/p • - water saturation • - T = -15 C (near optimum T) • initial mass 10-8 g • (eq. 9.4) • Water droplet: • - r0 = 25 mm • continuous collection growth • (eq. 8.15) • - collected drop radii, 10 mm • - LWC = 1 g m-3 Precipitation threshold What grows faster – ice by diffusion or water by collection? Initially, ice crystal grows faster and gets to precip size quicker. However, raindrop can exceed the growth rate of ice crystal
Ice Crystal: Ice crystal grows rapidly by diffusion Fractional rate of increase in mass, m-1(dm/dt) is large initially Grows more rapidly than the droplet up to 7 min. Growth to precipitation size (4 mg) in about 10 min Water droplet: Initial droplet growth is slow due to low values of collection efficiency (collection kernel is small) m-1(dm/dt) is small, but increases rapidly to a nearly steady value. After 30 min, the droplet mass matches that of the ice crystal Growth to precipitation size (4 mg) in about 20 min. Fig. 9.8. Times required for an ice crystal and a water droplet (solid curves) to grow to the indicated mass. Top scale gives the corresponding drop radius. Dashed curves are for the rates of fractional mass increase, referred to the scale on the right. (Rogers and Yau, 1989)
Precipitation processes* • Types of precipitation • Stratiform • Convective – deep (mixed phase) and shallow (warm) • Mixed stratiform-convective • Organization of precipitation • Precipitation theories • Mesoscale structure of rain Read Chap. 12 of R&Y
Types of precipitation Stratiform Large variations in the vertical, small in the horizontal Weak w, < 1 m s-1 (w < VT) Precipitation growth during the “fall” of a precipitation particle Convective Less substantial variations in the vertical, large in the horizontal Strong w, 5-50 m s-1 Time dependence Evolution to stratiform
Stratiform vs. convective rain • Stratiform • Temporal variability (Z/t) is small • Large gradients (Z/z) in the vertical • Large horizontal extent (small horizontal variations in Z • Presence of a bright band • Growth occurs as the precipitation particle falls • Particles: pristine ice, snow, aggregates, rain drops • Convective • Temporal variability is large • Horizontal gradients (Z/s) are large • Growth occurs at steady height (may rise or fall slowly) • Particles: pristine ice, snow, graupel, hail, aggregates, raindrops
A physical definition of convective vs. stratiform precipitation • Convective precipitation • hydrometeors move upwards at some point during the growth phase • growth time scale ~20-30 min • Rain rate, R > 10 mm hr-1 • Stratiform precipitation • hydrometeors fall during growth • R typically 1-5 mm hr-1 • growth time scale 1-2 h for a deep Ns system • significant stratiform precipitation likely requires an ice phase • the exception is drizzle from Sc, but this is not significant
Two examples illustrating convective vs. stratiformt-z section of 915 MHz profiler + surface rainfall rate (Tokay et al 1999)
Schematic of a convective cell: the elementary building blocks of convective precipitation. This is a vertical cross section through the core of an updraft cell. From Stalker and Knupp (2002). Wpbl contour shows the cell origin is within the PBL. Hd = threshold cloud layer height where a minimum updraft strength of Wd must develop Wd = threshold diluted updraft, i.e. updraft in an actual environment that is diluted by entrainment of subsaturated air into the cloud volume criterion of identifying precipitating convective cells Dd = threshold cloud layer depth Ad = threshold updraft area
The four parameters used by Stalker and Knupp (2002) to identify convective cells
An updraft cell will produce precipitation if the updraft is sustained. At this point, the updraft cell and precipitation (Z) cell are spatially correlated. Note the 2-3 km horizontal dimension of the cell. Max: 17 m/s Max: 40 dBZ
Observations of two primary cells in a multicell thunderstorm in Florida.
Updraft measurements in a supercell storm (left) and ordinary cell storm (right)
A simple flowchart of precipitation growth Remember this diagram
Production of precipitation in convective storms • Storms that generate precipitation have (at the surface) precip sizes < 10 mm (mostly rain, some small hail) • warm cloud, cold cloud, and a mix of both • Hailstorms, with hail size >10 mm at the surface • microphysics is more complicated by the presence of very large hydrometeors
Rain production in convective storms Three cases: • pure warm cloud • collision-coalescence is dominant • pure cold cloud • two primary growth processes (two-stage process): • growth of ice crystals (snow) by diffusion • growth of graupel by collection (accretion) • Hybrid (combo of warm/cold processes) • most complex of the three classes • all three primary growth processes can be active
Case 1 Precipitation growth in warm clouds Fig. 8.10. Simplified schematic of the precipitation processes active in clouds. Taken from Lamb (2001).
Formation of precipitation by coalescence What eqns describe this chart? Fig. 9.1. The activation of a population of CCN in an updraft of 2 m/s. Particle mass (salt + water) is shown as a function of height. The peak supersaturation of 1.14% at a height of 1.27 m above the start. The level at which S = 1.0 (base) is 97 m. At the starting height, CCN were assumed to be in equilibrium at S = 0.95. Above the dashed line, particles are larger than their critical size. Note the sharp distinction between activated and non-activated CCN. From Young (1993)
Radar measurements of initial raindrop formation from nucleation on giant CCN (NaCl) in FL. What is Z? Fig. 13. NCAR CP2 X-band radar reflectivity evolution of two small cumulus clouds on 5 and 10 Aug 1995. Reflectivity calculated from SCMS composite droplet distributions are shown for their corresponding 0.5-km layers on (B), (C), (F), and (G). Radar scan times (UTC) and azimuth angle are shown for each panel. From Laird et al 2000.
Time required to produce precipitation – warm cloud No entrainment precip develops quickly Quasi-stochastic model of coalescence that involves activation of CCN (Young 1975) Precipitation threshold in terms of radar reflectivity factor, > 20 dBZ Z = ∑niDi6 (mm6 m-3) dBZ = 10 log10 (Z/Z0) Dependent on the CCN spectrum, cloud base T, and updraft speed. Change in curvature is onset of collision/coalescence Define entrainment rate: Fig. 9.9. Radar reflectivity factor (dBZ) as a function of time for different entrainment rates. Cloud base T is 10 C, w = 3 m/s. From Young (1993).
Warmer cloud base implies higher water vapor mixing ratio, and hence higher adiabatic liquid water content. Maritime CCN promote higher precipitation efficiency via the warm cloud process Fig. 9.10. Z as a function of time for different CCN spectra. Cloud base T is 15 C, w = 3 m/s. From Young 1993. Fig. 9.11. Z vs time for different cloud base T. w = 1 m/s. From Young 1993
Formation of precipitation by cold cloud processes Glaciation: conversion of supercooled droplets into ice via introduction of ice (both nucleation and multiplication) p. 267 material here Fig. 10.1 Temperature rise (contoured) associated with glaciation at p = 700 mb. The broken line indicates that glaciation occurs with water vapor phase balance. From Young 1993.
Precipitation growth in cold convective clouds All these processes can occur in cold convective clouds Fig. 8.10. Simplified schematic of the precipitation processes active in clouds. Taken from Lamb (2001).
Growth of pristine ice and snow by deposition • Growth of graupel/snow by: • Riming • Deposition Mixed phase Limited raindrop growth Melting of ice Cloud nucleation Rain core
Simplified precipitation growth within deep convection Deposition Because of descending air A lot of cooling occurs due to melting/evaporation origin of gust front/cold pool in convective cells
Recall that growth at -15 ºC can be rapid • Bergeron process: For a mixed phase cloud, very high ice supersaturations are maintained as long as supercooled water exists (via nucleation within the updraft) • Around -15 C, two precipitation growth processes are active: • Ice crystal growth by diffusion (deposition is optimum • Accretion is active and quite efficient **Ice crystals grow at expense of supercooled droplets
Bergeron process Fig. 6.36 Laboratory demonstration of the growth of an ice crystal at the expense of surrounding supercooled water drops. [Photograph courtesy of Richard L. Pitter.] Taken from Wallace and Hobbs (2005).
Fig. 10.7 Comparative growth of a water drop and a frozen drop. Particle growth trajectories are shown for a uniform updraft of 5 m/s with cloud base T = 20 C. Both particles are introduced at the -8 C level as 0.25 mm water drops with one allowed to freeze at the start of the calculations. From Johnson (1987), taken from Young 1993. Graupel is growing faster accretion very efficient
Defining three cloud zones for hail growth EFZ = embryo-formation zone -Weak updrafts so graupel particles have time to grow HGZ = hail growth zone -Embryos that grow sufficiently enter this zone. -Stronger updraft needed to hold the hailstone in suspension -Updraft too weak, hailstone falls out, updraft too strong, pushes updraft into anvil where there is little liquid water FOZ = fallout zone Bottom figure shows suggest pathway for hail growth
Evolution of a multicell thunderstorm in Florida. Developing stage, precipitation is significant • Mixed phase cloud, with most of the initial precipitation development by collision-coalescence process • How do we know? • Dual-pol variable (ZDR)
Dual-Polarization • In the past, most radars only had the capability to transmit/receive horizontally polarized waves • Targets sampled only in the horizontal dimension • Dual-pol radars allow the transmit/receive of both horizontally & vertically polarized waves. • Targets sampled in both the horizontal and vertical dimension
Dual-Polarization • Using dual-pol radars, we can learn more about, the size, shape, and composition of precipitation particles • Benefits include: • Improved radar based rainfall totals • Improved ability to identify areas of heavy rainfall • Improved detection and mitigation of non-weather echoes • Easier identification of the melting layer during winter weather • Ability to classify precipitation type • New severe thunderstorm signatures
Differential Reflectivity (ZDR) • Ratio of the reflected horizontal and vertical power returns • Highly dependent on the shape and size of hydrometeors • Values typically range from -7.9 to 7.9 dB • ZDR can aid in identifying: • Hail • Melting layer • Rain/snow transition • Frozen precipitation types
ZDR & Rain • Strong relationship between raindrop diameter and shape • Smaller drops tend to be spherical • Horizontal and vertical pulses are similar • Low ZDR • As drops become larger, they become more oblate • Higher ZDR
Evolution of a multicell thunderstorm in Florida. Developing stage, precipitation is significant • Mixed phase cloud, with most of the initial precipitation development by collision-coalescence process • How do we know? • Dual-pol variable (ZDR) • Large ZDR at lower levels suggests large drop development through C-C
ZDR & Hail • Unlike rain, hail does not have a definite relationship between size and shape • Hail tends to tumble as it falls, appearing as an effective sphere to the radar • ZDR is biased near 0 dB • Classic hail signature is high reflectivity collocated with low ZDR
REF ZDR High Reflectivity Near 0 ZDR Hail Spike KHTX at 2053 UTC from 3/2/2012
Hytop 88D ARMOR REF REF ZDR ZDR KHTX and ARMOR Examples from March 2, 2012
Late mature stage: Updraft now found at extreme upper levels of storm Largest drops near the surface drop fallout, precip loading, Storm is dying
Linear Depolarization Ration (LDR) • Ratio of a vertical power return from a horizontal pulse or a horizontal power return from a vertical pulse • Detects tumbling, wobbling, canting angles, phase and irregular shaped hydrometeors • Large Rain Drops (> -25 dB) • Hail, hail and rain mixtures (-20 to -10 dB) • Wet Snow (-13 to -18 dB)
Mature phase: • w, Z and ZDR – warm and cold microphysical processes are active • LDR indicates the presence of wet, tumbling ice. • X-band attenuation is most substantial for water-coated ice. • Good example of mixed phase growth.
Vigorous growth of convective cell Strong updraft lofts large drops (high ZDR) above the freezing level The frozen drops experience rapid growth by accreting cloud water. This leads to what is known as an LDR “cap”, indicating mixed phase precip.
Examples from MIST • Microburst and Severe Thunderstorm (MIST) • A single-cell storm from 20 July 1986 • Well studied: Wakimoto and Bringi (1988); Goodman et al. (1988); Tuttle et al. (1989); Kingsmill and Wakimoto (1991); Zeng et al. (2000) • Produced hail within 10 min of radar detected Z > 10 dBZ; extremely efficient accretional growth processes • Microburst • Focus is on the development and interaction of supercooled water, graupel and hail as related to the rapid development and demise of the dominant accretional growth period.
Early stage development • Zmax (40-45 dBZ) located at 4-4.5 km • ZDR > 1.5 coincides with Z > 45 dBZ • Indicates Z core consists of raindrops with D > 1.8 mm • Elevated ZDR exists slightly above 0C level… indicate supercooleddrops • This suggests the formation of initial precipitation core was dominated by coalescence
~6 minutes later… the storm has intensified and grown vertically • Zmax > 55 dBZ at 7.5 km • Strong LDR values (-18 to -13 dB; not shown) was associated with the Zmax, indicating substaintial depolarization caused by frozen drops or tumbling irregular shaped hail • ZDR values were weak to moderate (0.5 to 2.5 dB) in the Z core… combination of all three variables suggests coexistence of liquid water and hail • Updraft enters the left side of the cell and slants slightly upward… vertical velocity center is collocated with supercooled water and hail is present at top of the updraft • Hail formed rapidly between the two periods… initial hail embryos were likely large drops that formed by coalescence of liquid water below 6 km, rose, froze into large drops, and continued to collect small cloud droplets
~6 minutes later… storm continues to strengthen and grow vertically • Zmax > 65-70 dBZ between 6-8 km • ZDR in top half of the core (6-10 km) were negative, indicating hail or graupel • Large amount of supercooled water seen previously has now glaciated in the elapsed 6 minutes • Rapid growth of echo top suggests the latent heat release during glaciation may have played a role in the rapid growth of the upper portion of the cell • Hydro ID shows bottom of hail region has sank below 0C, associated with negative vertical velocity on SW side • Large ZDR (>3.5 dB), located under Z core from 3 km to sfc is likely caused by melting of hail into large raindrops
~6 minutes later… Z core has descended dramatically • Positive ZDR column on west side of cell indicates raindrops… elevated positive ZDR indicates the updraft was still active in this part of the cell, despite storm collapse • East side of cell, horizontal 0.5 dB ZDR contour is clear boundary b/w ice and water • Despite hail fallout, graupel remains elevated in upper portion of the storm, suspended by positive vertical motion