Download
1 / 44
440 likes | 575 Views
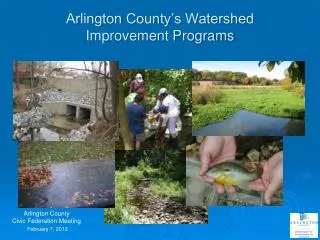
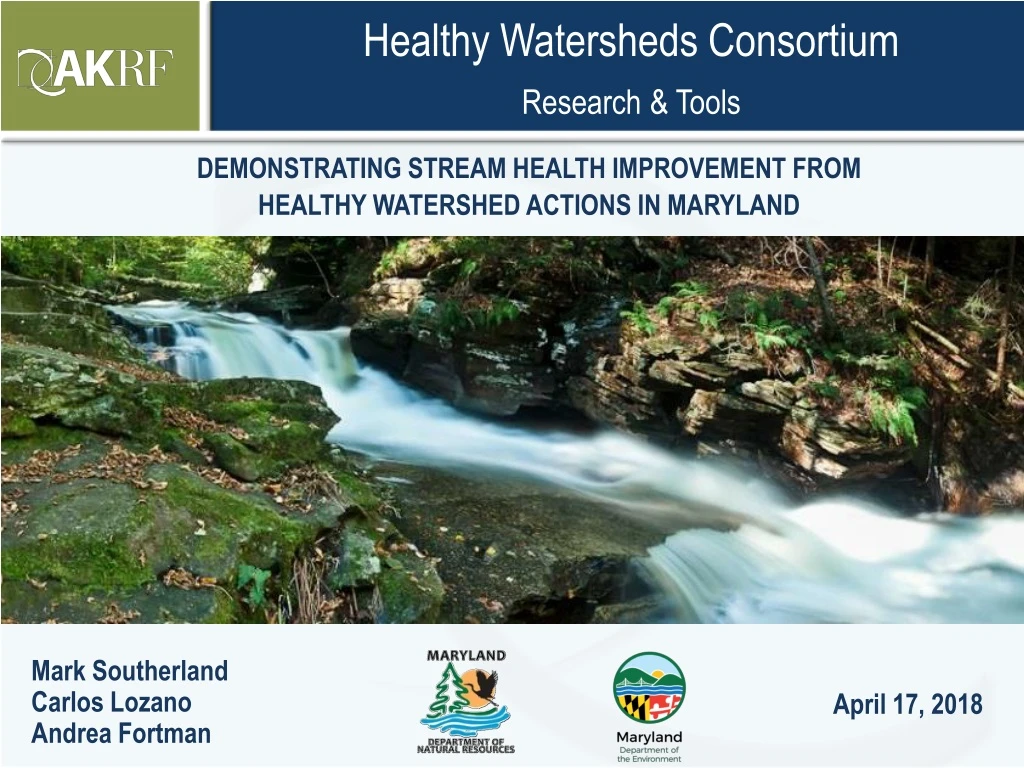
Healthy Watersheds Consortium Research & Tools. Demonstrating Stream Health Improvement from Healthy Watershed Actions in Maryland. Mark Southerland Carlos Lozano Andrea Fortman. April 17, 2018. Outline. Research Question Methods Results Conclusions. Research Question.

E N D
Healthy Watersheds Consortium Research & Tools Demonstrating Stream Health Improvement from Healthy Watershed Actions in Maryland Mark Southerland Carlos Lozano Andrea Fortman April 17, 2018
Outline Research Question Methods Results Conclusions Outline
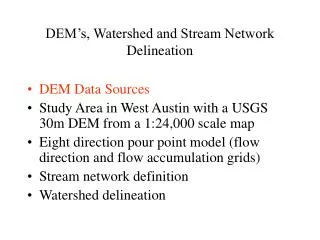
Research Question General question: What is the effect of healthy watershed actions on stream condition? Specific question: What is the condition of Maryland streams in protected vs. non-protected areas from 1995-2016? Questions
Methods • Stream Data • Maryland Biological Stream Survey • Protected Lands • MD iMAP • Chesapeake Bay Program • Statistical Analysis • Logistic Regression Mixed Model • Generalized Linear Mixed Model Methods
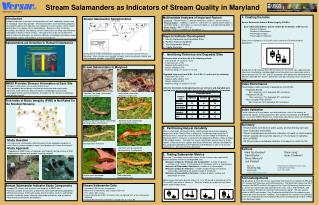
Stream Data • Maryland Biological Stream Survey • 5,000 sites sampled over 20 years • Fish IBI and Benthic invertebrate IBI as indicators of stream condition • IBI ≥ 3 is healthy (non-impaired) on scale 1-5 Methods
MBSS Sites Methods
Protected Lands Methods
Protected Lands • Types of protected areas • Coastal and Estuarine Land Conservation Program • DNR Owned Properties and Conservation Easements • Forest Conservation Act Easements • Protected Federal Lands • Local Protected Lands • Private Conservation Lands • Maryland Environmental Trust Easements • Maryland Agricultural Land Preservation Foundation Easements • Rural Legacy Properties • Transfer Development and Purchase Development Rights Methods
Protected Land Types • Consolidated categories of protected areas • All protected areas • DNR-owned lands and easements • 100-acre minimum areas • 100-acre minimum DNR areas Methods
DNR Lands • Forest Fire Tower sites • Wildlife Management Areas • Fishery Management Propagation Areas • Fishery Management Public Fishing Areas • State Wildlands • Heritage Conservation Sites • Marine/Communication Facilities • Undesignated lands State Parks Natural Resources Management Areas Natural Environmental Areas State Battlefields Rail Trails State Forests Demonstration Forests John S. Ayton Tree Nursery Chesapeake Forest Lands Methods
Statistical Analyses • Logistic Regression Mixed Model • Binomial distribution: Probability of IBI ≥ 3 • IBI = 3 is the threshold for “healthy” condition • Random slope and MDE8 watershed factor • Generalized Linear Mixed Model • Gaussian distribution: IBIs as response • Random slope and MDE8 watershed factor Methods
Logistic Regression Mixed Model Methods
Generalized Linear Mixed Model Methods
Sample Size (all sites) Methods
Sample Size (tested classes) Methods
Sites on Protected Lands Methods
Sites on Unprotected Lands Methods
Hypotheses Results • Are protected areas always healthy? • Is stream condition better with type of protection? • Size • Management • Length of time protected • Is more protected land in a watershed better? • Especially well-managed lands
Land use Results
Land use matters Results
DNR sites Results
DNR sites are better Results
DNR sites are better Results
DNR sites are better Results
DNR sites are better Results
Large sites Results
Large sites are better Results
Large DNR Sites Results
Large DNR sites are better Results
Protecting Watersheds MD8 average 90 mi2 Results
Percent of watershed protected Results
Percent of watershed protected Results
Percent of watershed protected Results
Percent of watershed protected Results
Protecting Watersheds Results
Conclusions Conclusions • Not all protected areas are created equal • Management, size, and time protected matter • Truly protected streams and watersheds are in better condition Preserving healthy watersheds and “green infrastructure networks” provide ecosystem benefits over time