Download
1 / 48
490 likes | 667 Views
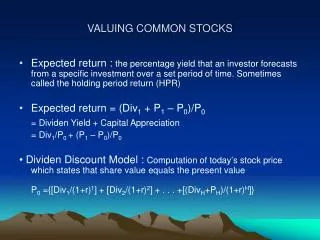
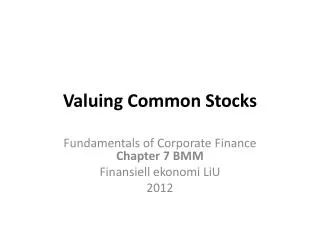
Valuing Common Stocks. Dividend Discount Model - Computation of today’s stock price which states that share value equals the present value of all expected future dividends. Valuing Common Stocks.

E N D
Valuing Common Stocks Dividend Discount Model - Computation of today’s stock price which states that share value equals the present value of all expected future dividends.
Valuing Common Stocks Dividend Discount Model - Computation of today’s stock price which states that share value equals the present value of all expected future dividends. H - Time horizon for your investment.
Valuing Common Stocks Example Current forecasts are for XYZ Company to pay dividends of $3, $3.24, and $3.50 over the next three years, respectively. At the end of three years you anticipate selling your stock at a market price of $94.48. What is the price of the stock given a 12% expected return?
Valuing Common Stocks Example Current forecasts are for XYZ Company to pay dividends of $3, $3.24, and $3.50 over the next three years, respectively. At the end of three years you anticipate selling your stock at a market price of $94.48. What is the price of the stock given a 12% expected return?
Valuing Common Stocks If we forecast no growth, and plan to hold out stock indefinitely, we will then value the stock as a PERPETUITY.
Valuing Common Stocks If we forecast no growth, and plan to hold out stock indefinitely, we will then value the stock as a PERPETUITY. Assumes all earnings are paid to shareholders.
Valuing Common Stocks Constant Growth DDM - A version of the dividend growth model in which dividends grow at a constant rate (Gordon Growth Model).
Valuing Common Stocks Example- continued If the same stock is selling for $100 in the stock market, what might the market be assuming about the growth in dividends? Answer The market is assuming the dividend will grow at 9% per year, indefinitely.
Valuing Common Stocks • If a firm elects to pay a lower dividend, and reinvest the funds, the stock price may increase because future dividends may be higher. Payout Ratio - Fraction of earnings paid out as dividends Plowback Ratio - Fraction of earnings retained by the firm.
Valuing Common Stocks Growth can be derived from applying the return on equity to the percentage of earnings plowed back into operations. g = return on equity X plowback ratio
Valuing Common Stocks Example Our company forecasts to pay a $5.00 dividend next year, which represents 100% of its earnings. This will provide investors with a 12% expected return. Instead, we decide to plow back 40% of the earnings at the firm’s current return on equity of 20%. What is the value of the stock before and after the plowback decision?
Valuing Common Stocks Example Our company forecasts to pay a $5.00 dividend next year, which represents 100% of its earnings. This will provide investors with a 12% expected return. Instead, we decide to blow back 40% of the earnings at the firm’s current return on equity of 20%. What is the value of the stock before and after the plowback decision? No Growth With Growth
Valuing Common Stocks Example Our company forecasts to pay a $5.00 dividend next year, which represents 100% of its earnings. This will provide investors with a 12% expected return. Instead, we decide to blow back 40% of the earnings at the firm’s current return on equity of 20%. What is the value of the stock before and after the plowback decision? No Growth With Growth
Valuing Common Stocks Example - continued If the company did not plowback some earnings, the stock price would remain at $41.67. With the plowback, the price rose to $75.00. The difference between these two numbers (75.00-41.67=33.33) is called the Present Value of Growth Opportunities (PVGO).
Valuing Common Stocks Present Value of Growth Opportunities (PVGO) - Net present value of a firm’s future investments. Sustainable Growth Rate - Steady rate at which a firm can grow: plowback ratio X return on equity.
FCF and PV • Free Cash Flows (FCF) should be the theoretical basis for all PV calculations. • FCF is a more accurate measurement of PV than either Div or EPS. • The market price does not always reflect the PV of FCF. • When valuing a business for purchase, always use FCF.
FCF and PV Valuing a Business The value of a business is usually computed as the discounted value of FCF out to a valuation horizon (H). • The valuation horizon is sometimes called the terminal value and is calculated like PVGO.
FCF and PV Valuing a Business PV (free cash flows) PV (horizon value)
FCF and PV Example Given the cash flows for Concatenator Manufacturing Division, calculate the PV of near term cash flows, PV (horizon value), and the total value of the firm. r=10% and g= 6%
FCF and PV Example - continued Given the cash flows for Concatenator Manufacturing Division, calculate the PV of near term cash flows, PV (horizon value), and the total value of the firm. r=10% and g= 6% .
FCF and PV Example - continued Given the cash flows for Concatenator Manufacturing Division, calculate the PV of near term cash flows, PV (horizon value), and the total value of the firm. r=10% and g= 6% .
WHAT DETERMINES THE REQUIRED RATE OF RETURN ON AN INVESTMENT? • REQUIRED RETURN DEPENDS ON THE RISK OF THE INVESTMENT • GREATER THE RISK, GREATER THE RETURN • WHAT KIND OF RISK RESULTS IN A HIGHER RETURN? • LOOK AT THE HISTORY OF CAPITAL MARKETS. • RETURNS FROM NONFINANCIAL INVESTMENTS HAVE TO BE COMPARABLE WITH RETURNS FROM FINANCIAL INVESTMENTS OF SIMILAR RISK
IBBOTSON ASSOCIATES COMMON STOCKS S&P500 SMALL STOCKS SMALLEST 20% NYSE STOCKS LONG-TERM CORPORATE BONDS HIGH QUALITY 20-YEAR CURRENT MATURITY LONG-TERM TREASURY BONDS 20-YEAR CURRENT MATURITY US TREASURY BILLS CURRENT MATURITY < 1 YEAR
VALUE AT END OF 1994 OF $1 INVESTMENT AT THE BEGINNING OF 1926 NOMINAL REAL SMALL CAP $2,843 $340 S&P500 $811 $97 CORPORATE BONDS $38 $4.5 TREASURY BONDS $26 $3.1 T-BILLS $12 $1.5 INFLATION $7 $7 AT THE END OF 1994 HAD THE SAME PURCHASING POWER AS $1 AT THE BEGINNING OF 1926
RISKS OF DIFFERENT ASSET CLASSES SECURITYRISK TREASURY BILLS NO RISK IN NOMINAL RETURN BUT UNCERTAIN REAL RETURN TREASURY BONDS AND INTEREST RATE RISK CORPORATE BONDS AND DEFAULT RISK AND EVENT RISK COMMON STOCKS AND MARKET RISK AND UNSYSTEMATIC RISK
AVERAGE RETURNS AND STANDARD DEVIATIONS1926 - 1994 Average Average Average nominal real risk Portfolioreturnreturnpremium Treasury bills 3.7% 0.6% 0 % Government bonds 5.2 2.1 1.4 Corporate bonds 5.7 2.7 2.0 Common stocks 12.2 8.9 8.4 Small-firm stocks 17.4 13.9 13.7 Source: Stocks, Bonds, Bills, and Inflation: 1995 Yearbook, Ibbotson Associates, Chicago, 1995
THE U.S. STOCK MARKET HAS BEEN APROFITABLE BUT VARIABLE INVESTMENT Source: Ibbotson Associates (1989)
ANNUAL MARKET RETURNS IN THE US1926 - 1994 SOURCE: IBBOTSON ASSOCIATES (1989) 13 11 9 9 8 4 3 2 2 1 1 • 50 • 40 • 30 • 20 • 10 10 0 20 30 40 50 60 Return, percent
STATISTICAL MEASURES OF SPREAD • VARIANCE, s2 = E(r - r)2 • -UNITS ARE (RETURN)2 • STANDARD DEVIATION, s = VARIANCE(r) • -UNITS ARE RETURN
CALCULATING VARIANCE AND STANDARD DEVIATION OF MERCK RETURNS FROM PAST MONTHLY DATA Deviation from mean Squared MonthReturnreturndeviation 1 5.4% 2.6% 6.8 2 1.7 - 1.1 1.2 3 - 3.6 - 6.4 41.0 4 13.6 10.8 116.6 5 - 3.5 - 6.3 39.7 6 3.20.4 0.2 Total 16.8 205.4 Mean: 16.8/6 = 2.8% Variance: 205.4/6 = 34.2 Standard deviation: 34.2 = 5.9% per month Annualized standard deviation 5.9 x (12) = 20.3%
AVERAGE RETURNS AND STANDARD DEVIATIONS1926 - 1994 Average Average Average Standard nominal real risk deviation Portfolioreturnreturnpremiumof returns Treasury bills 3.7% 0.6% 0 % 3.3% Government bonds 5.2 2.1 1.4 8.7 Corporate bonds 5.7 2.7 2.0 8.3 Common stocks 12.2 8.9 8.4 20.2 Small-firm stocks 17.4 13.9 13.7 34.3 Source: Stocks, Bonds, Bills, and Inflation: 1995 Yearbook, Ibbotson Associates, Chicago, 1995
VARIABILITY IN STOCK MARKET RETURNS • BRIEF PERIODS OF EXTREMELY HIGH VOLATILITY • OCTOBER 19, 1987, MARKET FELL 23% IN ONE DAY
VARIABILITY IN RETURNS OF INDIVIDUAL STOCKS • CALCULATED OVER RECENT FIVE-YEAR PERIOD • FIRM FACES CHANGING BUSINESS RISKS OVER 70-YEAR PERIOD • CALCULATE MONTHLY VARIANCE AND MULTIPLY BY TWELVE, ASSUMING SUCCESSIVE MONTHLY RETURNS ARE INDEPENDENT • STANDARD DEVIATION INCREASES WITH THE SQUARE ROOT OF THE LENGTH OF TIME OVER WHICH IT IS BEING MEASURED • MOST STOCKS MORE VARIABLE THAN MARKET • DIVERSIFICATION REDUCES VARIABILITY • CHANGES IN THE PRICE OF DIFFERENT STOCKS ARE NOT PERFECTLY CORRELATED • TEND TO OFFSET EACH OTHER
DIVERSIFICATION ELIMINATES UNIQUE RISK Portfolio standard deviation UNIQUE RISK MARKET RISK 5 10 Number of securities
INDIVIDUAL STOCKS HAVE TWO KINDS OF RISK: • MARKET RISK • OR SYSTEMATIC RISK OR UNDIVERSIFIABLE RISK • AFFECTS ALL STOCKS • UNIQUE RISK • OR UNSYSTEMATIC RISK OR DIVERSIFIABLE RISK OR SPECIFIC RISK OR RESIDUAL RISK • AFFECTS INDIVIDUAL STOCKS OR SMALL GROUPS OF STOCKS • UNIQUE RISK OF DIFFERENT FIRMS UNRELATED • ELIMINATED BY DIVERSIFICATION
UNIQUE OR UNSYSTEMATIC RISK • A DRUG TRIAL SHOWING THAT BETA BLOCKERS INCREASE RISK OF CANCER IN OLDER PEOPLE WILL AFFECT PFIZER’S STOCK • BUT HAS NO AFFECT ON SHARES OF GM OR IBM • A STRIKE AT A SINGLE GM PLANT WILL AFFECT ONLY GM AND PERHAPS ITS SUPPLIERS AND COMPETITORS • A HOT SUMMER WILL INCREASE DEMAND FOR AIR CONDITIONERS • BUT WON’T AFFECT THE DEMAND FOR COMPUTERS
MARKET OR SYSTEMATIC RISK • ALL FIRMS AFFECTED BY ECONOMY AND EXPOSED TO MARKET RISK • EXAMPLE: SURPRISE IN RATE OF GROWTH IN GNP • MARKET RISK CANNOT BE DIVERSIFIED AWAY
PORTFOLIO RISK • RISK OF A WELL-DIVERSIFIED PORTFOLIO DEPENDS ONLY ON THE MARKET OR SYSTEMATIC RISK OF THE SECURITIES IN THE PORTFOLIO • RISK OF A NON- DIVERSIFIED PORTFOLIO DEPENDS ON THE MARKET RISK AND THE UNIQUE RISK OF THE SECURITIES IN THE PORTFOLIO
SYSTEMATIC RISK OF A STOCK MEASURED BY ITS BETA COEFFICIENTb • THE MARKET OR AN AVERAGE STOCK HAS b =1 • A STOCK WITH b =2 HAS TWICE AS MUCH SYSTEMATIC RISK AS THE MARKET • AN INVESTOR IN A HIGH BETA STOCK WILL EXPECT TO EARN A HIGHER RETURN THAN AN INVESTOR IN A LOW BETA STOCK
MAJOR INVESTORS HOLD DIVERSIFIED PORTFOLIOS, WITH LITTLE OR NO DIVERSIFIABLE OR UNIQUE RISK THE RETURN ON A PORTFOLIO, DIVERSIFIED OR NOT, DEPENDS ONLY ON THE MARKET RISK OF THE PORTFOLIO • The market doesn’t reward us for taking unique risks we can avoid at very little cost by diversification • otherwise mutual funds would always sell at a premium to the value of their underlying shares
MARKET RISK (BETA) FOR COMMON STOCKS1989 - 1994 StockBetaStockBeta AT&T .92. Exxon .51 Biogen 2.20 Ford Motor Co. 1.12 Bristol Myers Squib .97 General Electric 1.22 Coca Cola 1.12 McDonald’s 1.32 Compaq 1.18 Microsoft 1.23
BIOGEN • b = 2.2 • BIOGEN HAS 2.2 TIMES AS MUCH MARKET RISK AS THE MARKET • RELATION BETWEEN b AND ACTUAL RETURNS NOT PRECISE BECAUSE OF BIOGEN’S UNIQUE RISK • ACTUAL RETURNS SCATTERED ABOUT FITTED LINE
RISK OF INDIVIDUAL STOCKS 1. TOTAL RISK = DIVERSIFIABLE RISK + MARKET RISK 2. MARKET RISK IS MEASURED BY BETA, THE SENSITIVITY TO MARKET CHANGES EXPECTED STOCK RETURN beta EXPECTED MARKET RETURN
DIVERSIFICATION AND VALUE ADDITIVITY • DIVERSIFICATION MAKES SENSE FOR INVESTORS • DOES IT ALSO MAKE SENSE FOR A FIRM? • IF DIVERSIFICATION MAKES SENSE FOR THE FIRM, EACH NEW PROJECT HAS TO BE ANALYZED IN THE CONTEXT OF THE FIRM’S PORTFOLIO OF EXISTING PROJECTS • VALUE OF THE DIVERSIFIED PORTFOLIO OF PROJECTS WOULD BE GREATER THAN THE SUM OF THE PROJECTS CONSIDERED SEPARATELY • NO. INVESTORS CAN EASILY DIVERSIFY BY HOLDING DIFFERENT SECURITIES; THEY WILL NOT PAY MORE FOR FIRMS THAT DIVERSIFY • IN COUNTRIES WITH EFFICIENT CAPITAL MARKETS, DIVERSIFICATION DOES NOT INCREASE OR DECREASE A FIRM’S VALUE • TOTAL VALUE OF A FIRM IS THE SUM OF ITS PARTS
SECURITY MARKET LINE EXPECTED RETURN Expected market return MARKET PORTFOLIO Risk free rate 0 .5 1.0 BETA r = rf + b (rm - rf)
MARKET RISK PREMIUM • rm - rf • RATE OF RETURN ON MARKET - T-BILL RATE • HAS AVERAGED 8.4% OVER 69 YEARS
INVESTMENTS LYING BELOW THE SECURITY MARKETLINE ARE DOMINATED BY A MIXTURE OF THE MARKET PORTFOLIO AND THE RISKLESS ASSET EXPECTED RETURN r k m r k f 1.0 BETA
EXPECTED RETURN ON AT&T STOCK AT BEGINNING OF 1995 • b = 0.92 • INTEREST RATE ON T-BILLS rf= 6% • MARKET RISK PREMIUM rm - rf= 8.4% • EXPECTED RETURN ON AT&T r = rf + b (rm - rf) = 6 + .92 X 8.4 = 13.7%