Download
1 / 29
290 likes | 352 Views
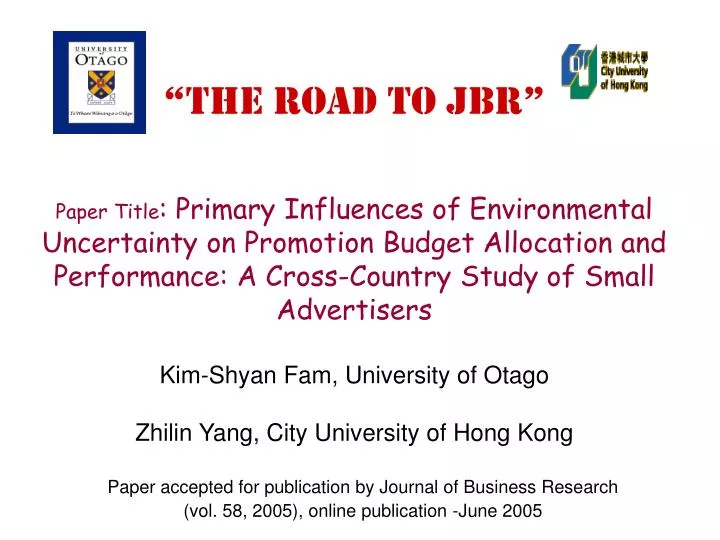
“The Road to JBR” Paper Title : Primary Influences of Environmental Uncertainty on Promotion Budget Allocation and Performance: A Cross-Country Study of Small Advertisers Kim-Shyan Fam, University of Otago Zhilin Yang, City University of Hong Kong.

E N D
“The Road to JBR”Paper Title: Primary Influences of Environmental Uncertainty on Promotion Budget Allocation and Performance: A Cross-Country Study of Small AdvertisersKim-Shyan Fam, University of OtagoZhilin Yang, City University of Hong Kong Paper accepted for publication by Journal of Business Research (vol. 58, 2005), online publication -June 2005
Promotion Budget Allocation Performance Environmental Uncertainty Control Variables Conceptual Background Figure shows that promotion budget allocation decisions could be influenced by retailers’ perceptions of the environment. Model is based on environment-strategy-performance paradigm. Model is an extension of that provided by Low and Mohr, 1992, 1998; Piercy, 1986; Lilien and Weinstein, 1984.
Resource-based Theory • A retailer’s competitive advantage comes from its resources and capabilities • Retailers will utilise various promotional tools to help consumers become aware of available goods and services, to attract new customers, and to increase sales and market share
Resource-based Theory • Might use below-the-line or above-the-line promotions • Small businesses are often constrained by budget, lack of time and expertise to limited and often ad hoc irrational promotion decisions • Hence, opportunistic retailers are more likely to focus on taking advantage of the changes in the environment
Research Question To what extent does environmental uncertainty influence small businesses’ decision on choice of promotional tools (in-store versus outdoor), budget allocation and market performance
In-store Promotion vs Outdoor Advertising • In-store promotion = price mark-downs, in-store displays • like dump bins, buntings, posters and end-of-aisles • cheap to stage, quick and efficient to draw customers • to the store • Outdoor advertising = prints, broadcast, radio, pr, sales • promotion and direct mail materials like leaflets, brochures • an outside in approach to attract potential customers • ability to reach a wider segments of the population
Research Hypotheses H1: Small businesses will allocate more advertising and promotion budget to in-store promotion than to outdoor advertising. H2: Environmental uncertainty has a more significant positive effect on budget allocation to outdoor advertising than to in-store promotion. H3: Outdoor advertising will have a more significant positive effect on market share change than will in-store promotion. H4: When environmental uncertainty is increasing, allocating more advertising and promotion budget to outdoor advertising than in-store promotion in an increasingly uncertain environment will lead to a significant positive change in market share.
Measures • eight Promotion tools • budget - based on personal selling spending where • retailers were asked compare budget spent on • each tool relative to spending on personal selling • environmental uncertainty (buying habits, nature of • competition, tastes and preferences of customers, market activities of • competitors and legal, political and economic constraints) • Performance = market share change (in the past 12 moths) • Control variables = chain store, shoe category and • number of employees
Measures • For reliability and validity of the ONE environmental scale (4 items), we • performed CFA using LISREL 8. • Alpha = 0.81 (NZ) and 0.76 (Portugal) • Average variance extracted (AVE)(0.61) and (0.56) • Composite reliability (0.78) and (0.75) • The four items were further examined by multi-sample analysis and • proved adequate model fit: • For NZ (χ2 = 4.64, d.f. = 2, RMSR = 0.034, CFI = 0.98, GFI = 0.99 • For Portugal (χ2 = 7.52, d.f. = 2, RMSR = 0.046, CFI =0.96, GFI = 0.97).
Data Analysis • Percentage Comparisons • Standardized Regression • Multicollinearity test • Chow test to assess the stability of the regression coefficients across the New Zealand and Portugal samples • Hierarchical Moderating Regression Analysis • Independent variables are mean centred
Table 1: Regression of Environmental Uncertainty and Control Variables to Budget Allocation Note: * p < .05, ** p < .01, *** p < .001; Chain Stores = six or more outlets under one brand name
Table 2: Moderated Regression Analysis of the Effect of Environmental Uncertainty on Market Share Change Note: * p < .05, ** p < .01, *** p < .001; Chain Stores = six or more outlets under one brand name
Results H1 = Accepted – small businesses allocate more budget to in-store promotion than outdoor advertising – NZ allocated 60.4% to in-store versus 39.6% outdoor PT allocated 74.8% to in-store versus 25.2% outdoor H2 = Partially accepted - greater environmental uncertainty will lead to more budget allocated to outdoor advertising - NZ result is positive, but insignificant - PT result is positive and significant
Results H3 = Accepted – budget spending on outdoor advertising has significant positive effect on market share change relative to in-store promotion – NZ & PT positive for outdoor advertising NZ& PT negative for in-store promotion H4 = Partially accepted – when environmental uncertainty is increasing, spending more on outdoor advertising is likely to improve market share - NZ result is positive and significant (when OD ad interacts with EU) - PT result is negative and insignificant (when OD ad interacts with EU) OD Ad = outdoor advertising interacts with (EU) environmental uncertainty
Discussion • retailers tended to allocate more budget to in-store promotion relative to outdoor advertising • but why is there a shift in promotional strategy when retailers perceived the environment is becoming uncertain? • - contingency theory says any solution is situational rather than absolute • - in-store promotion may not reach out to the wider audience relative to outdoor advertising – the pie is getting smaller • - thrust of outdoor advertising is to cast a wider net, draw more customers which will lead to a positive market share
Conclusion • Managers should understand their ‘business environment” as the environment-strategy-performanceparadigm indicates that a fit between environment characteristics and a strategic-orientation will lead to a superior performance. Our study confirms it. • Limitations: • only two countries were involved in the study • sample respondents were small business retailers • need to look at other industries
Take out Points • Specify theory/conceptual foundation at the front-end • of the manuscript • Get the ‘right’ literature • Simple model • 4. Hypotheses should be based on solid arguments
Take out Points • Methodology – used existing scales if possible • Do a rigorous test of reliability & Validity of scales used. • 7. Data analysis – many methods and try to triangulate • the results • 8. BUT, no matter how careful we were, there were gaps. • Here are the reviewers’ queries:
What Reviewer ‘A’ Wanted? To start with, the authors do not clearly define what they mean by “small” retailer’. They have included in the their sample two categories of retailers, namely independent and chain stores and while they give a definition of an independent retailer (one to five outlets, less than ten employees) they say nothing regarding the chain store. In this study, chain store is defined as six outlets or more under one brand name. We have included this definition in page 9, line 4 of the ‘Results’ section. It is also confusing that in the “Data Collection” section, they mention “for some relatively large retailers…” Thank you for pointing out the confusion. This sentence has been deleted as we tightened our manuscript from 34 to 20 pages.
What Reviewer ‘A’ Wanted? The most critical omission is the turnover of the sample companies. The authors should have reported the turnover of the sample companies in order to justify not only their “smallness” but also their ability to have a promotional budget. We agree with the reviewer that the turnover data is a good measure of ‘smallness’. But this sort of data is hard to come by as it is relatively sensitive and retailers are reluctant to reveal for fear of falling into the competitors’ hands. Nevertheless, from our preliminary discussions with some New Zealand retailers, we found that they spent approximately NZ$25,000 per annum on advertising and promotion. We have inserted this information in page 3, para 1, line 3.
What Reviewer ‘A’ Wanted? Besides, the most widely used method for determining advertising promotional budget (despite its major weakness) is the “percentage of sales approach” whereby marketers simply multiply a company’s past sales, plus a factor for planned sales growth or decline, by a standard percentage, based on both what the company traditionally spends and what the industry averages. Thank you for your good suggestion. We agree that the “percentage of sales” approach is widely used by businesses. The major concern in our study is that not all small retailers use this approach to determine their budget. Thus, comparisons can not be made across various retailers. In our study, we use “percentages of personal selling” due to three reasons: (see p. 8 under ‘Measures’ section)
What Reviewer ‘A’ Wanted? The authors measure the performance construct by asking the respondents “to indicate the extent to which their market share changed relative to their competitors in the past 12 months”. Who are their competitors? Those in the same street, in the same city or those competing nationally? How can we expect from a small retailer selling clothes or shoes in a neighbourhood to know its market share when large organizations in many sectors of the economy face extreme difficulties in defining their markets and estimating market share.
What Reviewer ‘A’ Wanted? Given the lack of archival data sources, the issue here is how to minimize the level of subjective measures. Under anonymity and confidentiality, archival source of data are no less subjective than subjective data assessed by top managers (Dean and Sharfman 1996). To overcome this problem, we chose the countrywide sales volume as the retail industry usually published an annual report of the past 12 months’ total sales. This way, the retailer will be able to compare his/her sales volume against the countrywide figure and finds out whether his/her market share has increased or decreased relative to the year before. We have clarified who our sample retailers’ competitors were in page 9, line 4 of the ‘Performance and Control Variables’ section. We have also pointed out the limitation of this measure in the ‘Limitation’ section (see p. 14).
What Reviewer ‘B’ Wanted? Would the study findings change significantly if retailing in developed versus underdeveloped countries were to be compared? This is an interesting suggestion for future research. For the present study, we looked at New Zealand and Portugal. Both countries have relatively advanced economy. The differences are in population size and GDP growth. We have pointed out the limitation of this study in the ‘Limitation’ section (see p. 14).
What Reviewer ‘B’ Wanted? In some countries when the environmental uncertainties are severe the retailers simply cut down their costs and promotion costs are about the first to go. In fact, the stagflation in the U.S. is related to such practice. This is a valid point. Our study was conducted at a particular point in time, that is, in an economy with strong growth and low inflation. We agree that the results might be different had we conducted the study in an economy with stagflation. . We have pointed out the limitation of this study in the ‘Limitation’ section (see p. 14).
What Reviewer ‘B’ Wanted? Why market share changes as opposed to the profitability or return on investment? Under uncertain business environment, one major motivation of promotion is to occupy more market share which in turn will bring more profit and improve the ROI. We chose the market share approach as it is one of the performance indices. We agree that it would be a better approach if we used a triangulate method, namely gauging performance through ‘market share’, ‘profitability’, and ‘ROI’. We have clarified our position on using market share in page 9, line 4 of the ‘Performance and Control Variables’ section, and also in the ‘Limitation’ section (see p. 14).
What Reviewer ‘B’ Wanted? The authors must talk about the shortcomings of the study and future research as to what needs to be done in the future studies. I believe this study is publishable with some minor. Thank you for your excellent suggestions. We have added a ‘Limitations and Future Research’ section in the manuscript (see p. 14) to explain the shortcomings of this study. Overall, this manuscript is now more focused and has greatly benefited from your suggestions.