Download
1 / 22
220 likes | 318 Views
Transparency 3. Click the mouse button or press the Space Bar to display the answers. Splash Screen. Example 3-2b. Objective. Construct and interpret line plots. Example 3-2b. Vocabulary. Line plot. Shows the frequency of data on a number line. Example 3-2b. Vocabulary. Cluster.

E N D
Transparency 3 Click the mouse button or press the Space Bar to display the answers.
Example 3-2b Objective Construct and interpret line plots
Example 3-2b Vocabulary Line plot Shows the frequency of data on a number line
Example 3-2b Vocabulary Cluster A group of data close together
Example 3-2b Vocabulary Outlier Data that is separated from the rest of the data
Example 3-2b Vocabulary Range The difference between the greatest and least numbers in the data set
Lesson 3 Contents Example 1Make a Line Plot Example 2Use a Line Plot to Analyze Data Example 3Use a Line Plot to Analyze Data
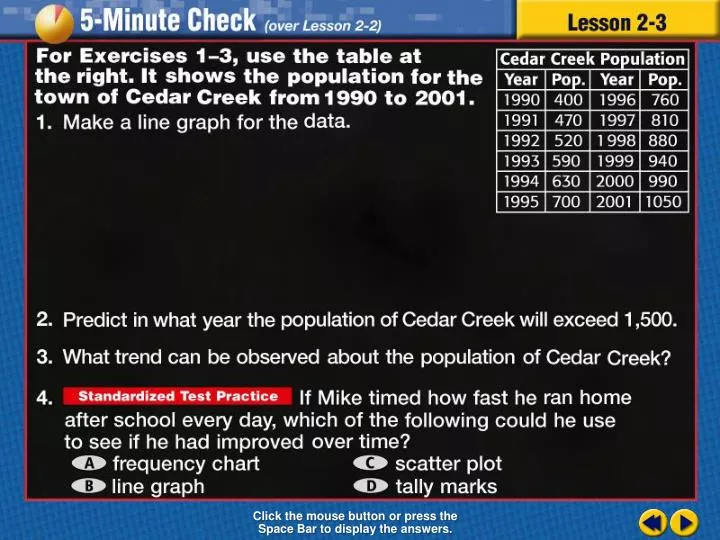
Age at Inauguration 57 51 54 56 61 61 49 49 55 52 57 64 50 51 69 57 50 47 54 64 58 48 55 51 46 57 65 55 60 54 61 52 54 62 68 54 56 42 43 46 51 55 56 Example 3-1a PRESIDENTSThe table below shows the ages of the U.S. presidents at the time of their inaugurations. Make a line plot of the data. Determine the smallest number Determine the largest number Range is 42 to 69 1/3
Age at Inauguration 57 51 54 56 61 61 49 49 55 52 57 64 50 51 69 57 50 47 54 64 58 48 55 51 46 57 65 55 60 54 61 52 54 62 68 54 56 42 43 46 51 55 56 Example 3-1a Range is 42 to 69 Determine a scale and interval for the number line To include both numbers begin at 40 and end at 70 EASY NUMBERS Note: Only numbered by 5’s but put the hash marks equal distance for all 1/3
Age at Inauguration 57 51 54 56 61 61 49 49 55 52 57 64 50 51 69 57 50 47 54 64 58 48 55 51 46 57 65 55 60 54 61 52 54 62 68 54 56 42 43 46 51 55 56 Example 3-1a Plot data by putting an x above the number for each piece of data × × × × × × × × × 1/3
Age at Inauguration 57 51 54 56 61 61 49 49 55 52 57 64 50 51 69 57 50 47 54 64 58 48 55 51 46 57 65 55 60 54 61 52 54 62 68 54 56 42 43 46 51 55 56 Example 3-1a × × × × × × × × × × × × × × × × × × 1/3
Age at Inauguration 57 51 54 56 61 61 49 49 55 52 57 64 50 51 69 57 50 47 54 64 58 48 55 51 46 57 65 55 60 54 61 52 54 62 68 54 56 42 43 46 51 55 56 Example 3-1a × × × × × × × × × × × × × × × × × × × × × × × × × × × 1/3
Age at Inauguration 57 51 54 56 61 61 49 49 55 52 57 64 50 51 69 57 50 47 54 64 58 48 55 51 46 57 65 55 60 54 61 52 54 62 68 54 56 42 43 46 51 55 56 Example 3-1a × × × × × × × × × × × × × × × × × × × × × × × × × × × × × × × × × × × × 1/3
Age at Inauguration 57 51 54 56 61 61 49 49 55 52 57 64 50 51 69 57 50 47 54 64 58 48 55 51 46 57 65 55 60 54 61 52 54 62 68 54 56 42 43 46 51 55 56 Example 3-1a × × × × × × × × × × × × × × × × × × × × × × × × × × × × × × × × × × × × × × × × × × × 1/3
Example 3-1a Answer: 1/3
Answer: Example 3-1b STUDY TIMEThe table below shows the number of minutes each student in a math class spent studying the night before the last math exam. Make a line plot of the data. 1/3
Example 3-2a CLIMATEThe line plot shows the number of inches of precipitation that fell in several cities west of the Mississippi River during a recent year. What is the range of the data? Range = Greatest - Least Write formula for range Find greatest number Range = 50 Range = 50 - 5 Find least number Range = 45 Subtract Answer:The range 45 inches. 2/3
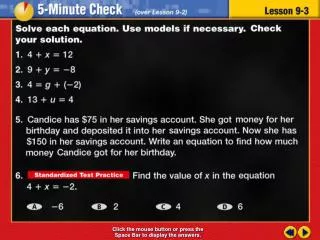
Example 3-2b AGEThe line plot below shows the ages of students in an introductory computer course at the local community college. What is the range of the data? Answer:Range = 26 years 2/3
Example 3-3b Identify clusters, gaps, and outliers if any exist in the line plot below and explain what they mean. There are data clusters between 11 and 13 inches and between 16 and 18 inches. Answer: Gap is from 18 to 23 and 27 to 32 Outliers could be 5 and 50 but they are not necessarily separated from other data 3/3
Example 3-2b * Identify clusters, gaps, and outliers if any exist in the line plot below and explain what they mean. Answer:The cluster is from 18 to 30. There is a gap between 30 years and 44 years. The outlier is 44 3/3
End of Lesson 3 Assignment