Download
1 / 29
290 likes | 448 Views
The exhibitions world: today and tomorrow. Paul Woodward Managing Director UFI AFIDA, Argentina 9 th August 2011. Today. Global overview & trends. Looking to the future. The exhibition world today. 2. EXHIBITIONS : Global estimates

E N D
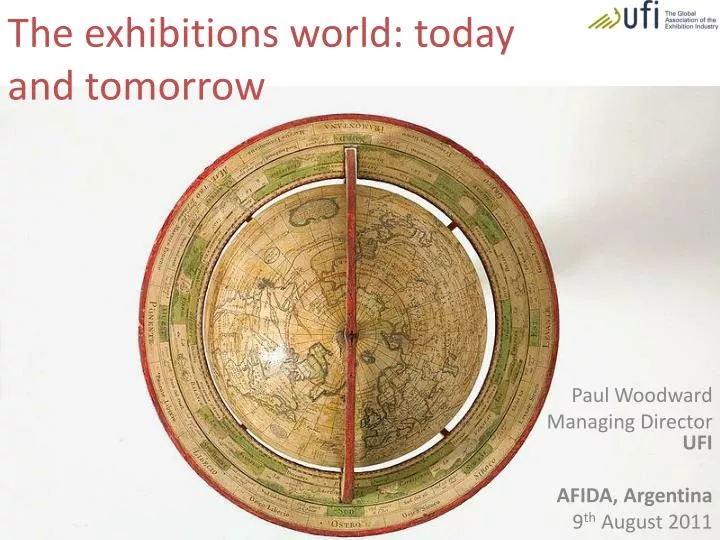
The exhibitions world: today and tomorrow Paul Woodward Managing Director UFI AFIDA, Argentina 9th August 2011
Today Global overview & trends Looking to the future ⓒ UFI 2011
The exhibition world today ⓒ UFI 2011
2. EXHIBITIONS: Global estimates 31 400 Exhibitions per year - 109 million net sqm rented 2.9 million direct exhibiting companies - 260 million visitors Regional breakdown 13 700 exhibitions - 53.0 million sqm (49%) 126.3 million visitors – 1.4 million exhibitors 12 500 exhibitions 28.3 million sqm (26%) 67.4 million visitors750 000 exhibitors 2 770 exhibitions 19.8 million sqm (18%) 47.2 million visitors 520 000 exhibitors 1 200 exhibitions 4.0 million sqm (4%) 9.5 million visitors 110 000 exhibitors 500 exhibitions - 1.0 million sqm (1%) 2.4 million visitors 27 000 exhibitors 700 exhibitions - 2.4 million sqm (2%) 5.7 million visitors 64 000 exhibitors
MAIN GLOBAL RESULTS of the World Map of Venues (2007) In 2006 • 1,062 venues(with a minimum of 5,000 sqm indoor exhibition space) identified worldwide • Total indoor exhibition space: 27.6 million sqm By 2010 • 1,104 venues, including:14 venues with less than 5,000 sqm in 200630 new venues 1, closed in 2006, will be reopened 3, operating in 2006, will be closed • Total indoor exhibition space:31.1 million sqm (+13%) 26
VENUES AND INDOOR EXHIBITION SPACE IN 2006 Scale Key figures Number of venues (World share) Exhibition space(World share) 6 million sqm 465 venues (44%) 14.3 million sqm (52%) 200 venues 359 venues (34%) 7.1 million sqm (26%) 127 venues (12%) 3.9 million sqm (14%) 38 venues (4%) 0.9 million sqm (3%) 16 venues (2%) 0.3 million sqm (1%) 25 venues (2%) 0.5 million sqm (2%) 32 venues (3%) 0.6 million sqm (2%) 27
VENUES AND INDOOR EXHIBITION SPACE IN 2010 (and growth since 2006) Key figures Scale % of world increase (sqm) – nr. of venues with changes Number of venues in 2010 (progression since 2006) Space in 2010 (progression since 2006) 6 million sqm 52% (+ 1.8 million sqm) – 99 venues 477 venues (+3%) 16.2 million sqm (+13%) 200 venues 17% (+0.6 million sqm) – 44 venues 370 venues (+3%) 7.7 million sqm (+8%) 21% (+ 0.7 million sqm) – 28 venues 143 venues (+13%) 4.6 million sqm (+20%) 1% (+0.04 million sqm) – 6 venues 40 venues (+5%) 0.9 million sqm (+4%) 0.3% (+ 0.01 million sqm) – 3 venues 17 venues (+6%) 0.3 million sqm (+6%) 1% (+0.04 million sqm) – 8 venues 24 venues (-4%) 0.6 million sqm (+7%) 7% (+ 0.2 million sqm) – 10 venues 33 venues (+3%) 0.9 million sqm (+38%) 28
UFI Impact • Presence of UFI Members in 85 countries (including the 40 largest countries in terms of GDP) and 205 differentcities • UFI membersExhibition Centers = 11,5 mn m² • UFI membersOrganizers = 3 500 exhibitions per year, or 34,6 Mn m² • UFI members host and organize 4,500 exhibitions, visited by more than 100 million visitors.
How the industry fared in the crisis Preliminary findings from UFI’s latest Global Barometer research
1. Gross Turnover % of companies declaring an increase of their turnover when compared to the same period the year before(regardless of possible biennial effects) Confirmation of the return of growth of Gross Turnover for a majority of companies (since the end of 2009 for AP, early 2010 for AM & end of 2010 for EUR – MEA hardly affected)
3. Perception of the economic crisis • % of companies declaring – in the last 3 surveys - that the impact of the “economic crisis” on their exhibition business is now over Confidence in the future is still rising in AP (65%). It increases in EUROPE, but there is a “half/half” feeling everywhere except AP. Note: MEA 49% (71% in Dec. 2010) is a chosen combination of a 29% for RSA and 55% for the rest of MEA.
4. Most important business issues • Distribution of all issues selected as the 3 most important ones This order is remarkably stable across surveys. “General economic” considerations, “local competition” and “internal managements challenges” are at the top of the agenda. Environmental and “other media” issues are not getting much priority…
Help yourself! ⓒ UFI 2011
Key trends Based on UFI Delphi research and member interviews ⓒ UFI 2011
Key growth areas • Emerging markets: take your acronym pick • BRIC • BIC • BRICSA • CIVET • MINT • Hybrid events • Multi-dimensional, non-traditional events ⓒ UFI 2011
Declining areas • Mid-sized national fairs • Head office support for all but the biggest international events is sinking. • The ‘marquee events’ are thriving. • New forms are taking their place. • IT and other industries where marketing events agencies are strong • Own company events are a real-challenge. • Non-traditional business events are testing the unimaginative organiser. ⓒ UFI 2011
Key challenges for exhibitions • Competition (in some markets) from over-capacity in venues • Online marketing and product news release • Continued uncertainties over balance of internet and face-to-face marketing • The industry needs better to communicate how a combination of these is the key to marketing effectiveness. • In-house activities and product launches have eaten into traditional events spend. • Will this be the source of tomorrow’s competition? • Targeting the Facebook generation with real world events. • Pressures on business travel • Cost controls • Environmental constraints ⓒ UFI 2011
Tomorrow’s competitors? ⓒ UFI 2011
Already happening… ⓒ UFI 2011
Future opportunities: linking traditional event models with… ⓒ UFI 2011
Multi-dimensional events ⓒ UFI 2011
UFI’s Delphi Study ⓒ UFI 2011
Thought leadership • “Together with exhibitors, visitors, specialized associations and the media the leading brand trade shows can become the place to meet all year long”. • “But we have to be careful: It is not just content, but valuable content and leadership in new ideas”. • “The role of trade shows will be changing. Trade shows will more and more act as community integrators, knowledge providers, discussion platforms, social network live grounds, etc.” ⓒ UFI 2011
pw@ufi.org www.ufi.org ⓒ UFI 2011