Download
1 / 20
200 likes | 277 Views
Solar bursts and lunar seismicity. Khavroshkin O . B ., Tsyplakov V . V . IPhE RAS, khavole@ifz.ru. Preface.

E N D
Solar bursts and lunar seismicity Khavroshkin O.B., Tsyplakov V.V.IPhE RAS, khavole@ifz.ru
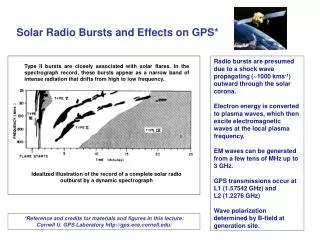
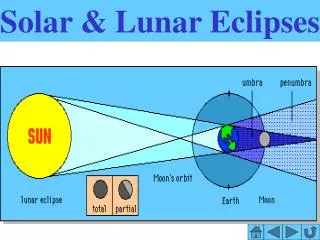
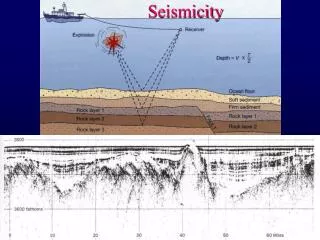
Preface • Display of activity of the Sun in lunar seismicity as separate events long time usually are interpreted as influence of solar-terrestrial tides which deformed the Moon and causing rocks crackling and / or weak seismic events [1]. With development of statistical methods of the analysis of the data on lunar seismicity (Nakamura’s Catalogue) and more open and wide approach to a nature moonquakes in particular detection of a new role and properties gas dust streams have appeared certificates on active influence on the Moon of the Sun and a solar wind [2]. Connection of the interplanetary shock waves (ISW) formed by solar bursts and influencing on a day time surface of the Moon in some day after bursts (for example 2, 4, 7 August, 1972y.) further was shown. Thus energy burst ISW on the influence on the Moon is comparable to impacts of the big meteorites and consequently is capable to derivate seismic waves accessible to registration [3].
Histograms search • The analysis of the wave response of lunar lithosphere on the burst ISW acting has revealed complex time structure of a seismic field, potential information content of all process, necessity to continue research. Histograms duration’s of records seismic events (seismograms) on the Moon long before solar burst, during burst and after bursts were originally constructed for 1972y.(fig.1). Comparison duration of histograms with the periods of own of the solar oscillations in a range of the short periods has found out their numerous concurrence and changes durations on quarters the sinodic lunar period. Histograms of durations for all lunar seismic events for 1972y. on quarters (duration 7.37days) – fig.1 (a, b, c, d), where: a – sunset, b - a new Moon, c - rising, d - a full Moon after bursts 2, 4,8 August, 1972y. Thus the appreciable number of durations coincided with the periods of own solar oscillation.
Let us look histograms duration of all lunar seismic events on quarters of the sinodic lunar period in a range from 1 up to 60 min. for time intervals: a - sunset, b- a new Moon (time of during solar bursts), c-in time rising, d - a time full Moon (after burst).
Fig. 1a. Distribution of lunar seismogram durations on sunset 2.08. 1972y.
Fig.1b. Distribution of lunar seismogram durations on new Moon time 9. 08. 1972y.
Fig.1c. Distribution of lunar seismogram durations on rising time 17.08. 1972y.
Fig.1d. Distribution of lunar seismogram durations on a full Moon time after bursts 2, 4,8 August, 1972y.
Detection and detailed consideration of concurrence seismogram durations (fig. 1) and the periods of own oscillations of the Sun [4], their dependence on the lunar period have demanded realization of quantitative estimations of the noticed features for each histogram. For this purpose the test histogram of own oscillations of the Sun on the standard theoretical data [4] was constructed.
Thus the test histogram is created on the basis of three models of own oscillations of the Sun in a range from 13 about 60 minutes (table 1). Construction of the test diagram passed as follows. In a range of the theoretical periods of oscillations of the Sun from 1 about 60 minutes histograms of quantity of the theoretical periods on different models of the Sun were under construction. The interval for the periods has made 1 minute, the quantity of the theoretical periods on all models of the Sun further was counted up. So the synthetic test histogram was constructed. At an estimation of a degree of correlation zero at numbers test and other histograms were cut off. In result the file from 12min up to 57min (45 values, table 2) same, as well as in table 1 is received.
%solar event: • 77.6; 85.4; 89.4; 85.4; 90; 95.8; • Common number event • 85; 85; 41; 66; 82; 120; 134.
In table 1: column: time series of seismogram durations for solar oscillation range; 2 column: test histogram created from solar oscillations [4]; 3 column: histogram of the distribution of durations of all the lunar seismic events (seismograms) in the range from 13 to 57 minutes in the quarter rising before burst; 4 column: histogram of the duration distribution of all lunar seismic events in the range of 13 to 57 minutes in a quarter full moon, before the burst; 5 column: histogram of the distribution of durations of all the lunar seismic events in the range from 13 to 57 minutes in a quarter of sunset; 6 column: histogram of the duration distribution of all the lunar seismic events in the range from 13 to 57 minutes in a quarter-moon during burst; 7 column: histogram of the distribution of durations of all the lunar seismic events in the range from 13 to 57 minutes in the quarter after the burst, 8 column: histogram of the distribution of durations of all the lunar seismic events in the range of 13 to 57 minutes in a quarter full moon after the burst. • Further factors of correlation (Table 2) between a test file and files were received: rising up to, a full Moon before burst, a new Moon during burst, rising, a full Moon after burst (columns 3-8).
Estimation of correlation between observant and theoretical values of histograms. • Correlation coefficients • r=0.26;r=04;1r=0.28;r=0.17;r=0.49;r=0.59 • Probably Non zero • 0.9;0.995;0.95;0.999;0.9995
Continue • In Table 2:The results of the correlation coefficients between the test histogram, column 2 (Table 1) and histograms: sunrise to column 3; the full moon to the burst column 4; column 5 nset; new moon during burst time on the column 6; column 7- sunrise; full moon after the burst- column 8 (columns 3 - 8).
For reception of the importance of the received factors of correlation (check of a zero hypothesis) • Fisher`s t-criterion • Where used: r - factor of correlation, n - quantity of degrees of freedom (in our case n = 45, i.e. it is equal to quantity of independent values at reception of factor of correlation). • At a zero hypothesis selective distribution of this statistics t is Student’s distribution with n-2 degrees of freedom. Accordingly for each calculated factor of correlation under the table of percentage points of Student’s t-distribution it is received quintiles for each factor of correlation (the third line of table 2). That is, for factor of correlation r = 0.59 with probability P > 0.9995 it is not equal to zero or significant (the fourth line of table 2). The same for other factors of correlation. • On the basis of this result is determined by a similar correlation with seismic data bars in the year of minimum solar activity in 1976. (Table 3). However, the number of seismic events n is insignificant in comparison with 1972. Correlation in the year of minimum solar activity (1976).
Correlation in the year of minimum solar activity (1976). • Correl. Coef. • r=0.325;r=0.27;r=0.126;r=0.04 • Probability non zero • Р=0.75; Р=0.75-- • Number of event • 11; 22; 18; 26
In Table 3: similar (Table 2) correlations with seismic histogram in the year of minimum solar activity in 1976y.: 2 -5 columns correlation coefficients of the lunar synodic Quarters period (2 line) and estimate the probability (3 line).
Accordingly, for 1976 the correlation coefficients obtained insignificant in comparison with 1972, this is probably due to both lack of powerful bursts and a small number of seismic events on the Moon. Equally significant correlation coefficients before and after the burst of outbursts (Table 2) have a fairly simple physical explanation. In our opinion, the solar bursts with high energy stimulates an increase in seismic events on the moon through the mechanisms of action to the surface of the Moon: photo acoustic (gamma- and X-ray emission), the variable solar wind dynamic pressure. Thus, the number of seismic events on the moon rose from 41 to 134 before the outburst after outburst, and this at a time when the principal amount of seismic events on the Moon due to the solar-terrestrial tides.
Conclusion • In addition, the fact that the similarity test of synthetic solar histogram based on their own periods of oscillations of the Sun with histograms of durations of seismic events on the Moon can be explained by modulation of the solar wind and the natural oscillations of the Sun from table 2, these variations are beginning to affect the solar wind long before the bursts . Thus, monitoring of the lunar seismic fields (the Moon as a detector) provides information on solar activity, that is forecast powerful solar bursts.
Reference • 1. Khavroshkin O.B., Tsyplakov V.V. Meteoroid stream impacts on the Moon: information of duration of seismograms // Proc. Conf. Meteoroids 2001 (ESA SP-495). Noordwijk, The Netherlands: ESA Publ. Division., 2001, p.p.13-21. • 2. Khavroshkin O.B., Tsyplakov V.V. Temporal structure of meteoroid stream and lunar seismicity according to Nakamura’s catalogue // Proc. Conf. Meteoroids 2001 (ESA SP-495). Noordwijk, The Netherlands: ESA Publ. Division., 2001, p.p. 95-105. • 3. Хаврошкин О.Б., Цыплаков В.В., Собко А. А. Солнечная активность и сейсмичность Луны. Инженернаяфизика.-2011,№3.-С.40-45. • 4. Christensen-Dalsgaard, J., Dirty Solar Models Astron. Astrophys. 73 p.p. 121-128 (1979)