Download
1 / 27
270 likes | 338 Views
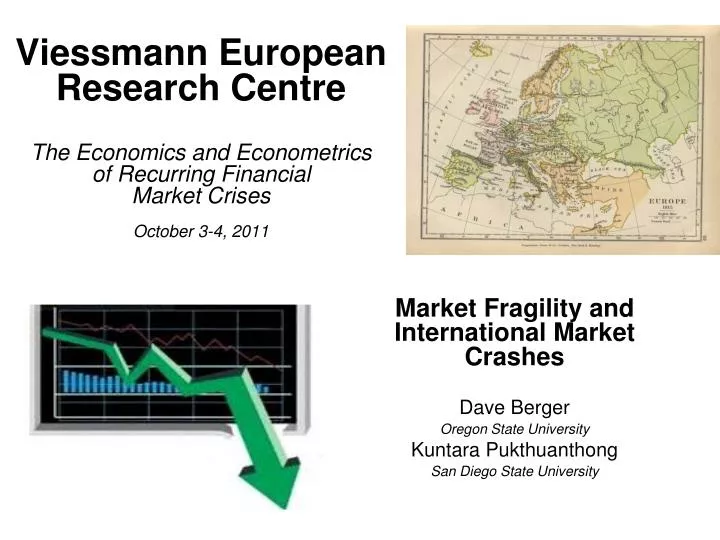
Viessmann European Research Centre The Economics and Econometrics of Recurring Financial Market Crises October 3-4, 2011. Market Fragility and International Market Crashes Dave Berger Oregon State University Kuntara Pukthuanthong San Diego State University. Input Selections. Matching

E N D
Viessmann European Research CentreThe Economics and Econometrics of Recurring Financial Market CrisesOctober 3-4, 2011 Market Fragility and International Market Crashes Dave Berger Oregon State University KuntaraPukthuanthong San Diego State University InputSelections Matching Procedure StockPerformance AnalystEstimates OLSRegression RobustnessCheck Objectives Conclusions
The Presentation at a Glance • Paper synopsis • Contributions • Pukthuanthong and Roll (2009)’s integration measure • Fragility Index • Data • Tests • Robustness Test • Conclusions and Implications Literature Review Data StockPerformance Variable Definition UnivariateTests Regression Analysis Objectives Conclusions
Paper Synopsis Develop a measure identifying international systematic risk commonly exposed to multiple countries • A measure, “Fragility Index” developed based on Pukthuanthong and Roll (2009)’s market integration measure • Test whether this measure implies the risk of a negative shock propagating international and of multiple markets jointly crashing Increase in FIperiods in which an increase in the probabilities (market crashes), and of joint co-exceedances across markets
Contributions 1. We present ex-ante measure that shows a strong and positive relation with ….. • prob (extreme market crashes) • prob (crashes propagating across markets) 2. Extend the contagion literature by identifying an important factor that relates to the likelihood of a shock in one market propagating internationally 3. Extend the systematic risk literature by presenting a generalizable and flexible measure 4. Provides implications to policy makers and portfolio managers
Pukthuanthong and Roll (2009) • Ameasure of time-varying integration based on R-square of the following: -US Dollar-denominated return for country or index j during day t, - the ithprincipal component during day testimated based on Pukthuanthong and Roll (2009) • Based on the covariance matrix in the previous year computed with the returns from 17 major countries, the “pre-1974 cohort” • The loadings across countries on the 1st PC or the world factor and others are measurable
Intuition • Extend the Pukthuanthong and Roll (2009) measure of integration to provide an estimate of systematic risk within international equity markets • PC 1 is a factor that drives the greatest proportion of world stock returns PC1 Countries that have high loading on PC1 Negative shock Go down together
Fragility index • Cross-sectionall average of time-varying loadings on the world market factor or PC1 across countries at each point in time • Fragility Index (“FI”) indicate …. • periods in which international equity markets are much more susceptible to a negative shock to the world market factor PC1 • Measure is generalizable and flexible • Capture any economic variable that increases loadings on the world market factor • Allows inclusion of a large international sample of countries in a study
Detail measure of FI • where • Our hypothesis: • Fragility level is based on in which represents the kth percentile of (80th, 90th, 95th, and 98th percentiles, for example)
Why loading on PC1, not R-square? • Integration may be a necessary but notsufficient criteria to identify periods of high systematic risk • Assume 2 world factors, Salt and Water • Country A relies mostly on Salt; country B relies mostly on Water • Country A has positive exposure while country B has negative exposure on Salt but • Negative shock in Salt will hurt A but benefit B
Why loading on PC1, not R-square? • Highintegration+ varyingexposure to underlying factors negative shocks might not have sharp impact on multiple markets High R-squared + Varying beta1 Propagating • Highintegration + similarexposure to underlying factors negative shocks impact on multiple market High R-squared + High beta1 Propagating - shock - shock
FI through time • m0 and q0 to represent the mean and the 75th percentile of the Fragility index plotted on the LHS. • ‘Return’ represents the equal-weighted all country index return, and is plotted on the RHS.
Define bad return days • A crash sub-sample - All days in which for arbitrary return percentile threshold k. • - Return to index j during day t • - A threshold percentile of full-sample returns for index j. • Negative co-exceedances- Days in which multiple countries or cohorts each experience a return below the threshold in question.
Data • Stock index returns from 82 countries from the Datastream • Classify countries into 3 cohorts based on countries appearance in the Datastream • Cohort 1 (developed markets) - before 1984 • Cohort 2 (developing markets) - during 1984-1993 • Cohort 3 (emerging markets) - after 1993 • Averaging countries into cohort index returns mitigates non-synchronous trading issues • Component countries would be spread across the globe • These components would trade through out the day
Findings • High FI leadsperiods in which the probabilities of market crashes, and of joint co-exceedances across markets • High FI prob(global crash across multiple countries) > prob (local crashes confined within a smaller number of countries) • Fragility - coefficient, on the 1st principal component according to Pukthuanthong and Roll (2009) • Country stock returns are regressed on 10 principal componentsusing daily observations from day t-500 through day t-1.
FI across cohorts and global crises • m0, m1, m2, and m3 represent the mean of at a given point in time for all cohorts, Cohorts 1, 2, 3, respectively. • Cohorts 1, 2, and 3 include countries first appearing on DataStream since pre-1974 to 1983, 1984-1993, and post-1993, respectively
Crisis and 75th percentile • q0, q1,q2, and q3 represent the 75th percentile of at a given point in time for all cohorts, Cohorts 1, 2, 3, respectively. • Cohorts 1, 2, and 3 include countries first appearing on DataStream since pre-1974 to 1983, 1984-1993, and post-1993, respectively
Average returns across risk states • As FI increases from the 1st to 10thdecile, mean returns decrease • A plunge in returns is most drastic in Cohort 3 • Standard deviation increases as FI increases
FI increases with prob(joint crashes) When all three cohort index returns below a threshold
Logistic regressions across cohorts When ALL cohorts crash
Contributions 1. Suggest an ex-ante measure that shows a strong and positive relation with ….. • prob (extreme market crashes) • prob (crashes propagating across markets) 2. Extend the contagion literature by identifying an important factor that relates to the likelihood of a shock in one market propagating internationally 3. Extend the systematic risk literature by presenting a generalizableand flexible measure 4. Provides implications to policy makers and portfolio managers
Conclusions • The probability of financial interdependence is highest during periods in which many countries share a high exposure to the world market factor or PC1 • Based on Pukthuanthong and Roll (2009) integration analysis, we develop FI as the cross-sectionalaverage loading on the world factor across countries • Our FI is a strong predictor of market crashes. • FI Prob (a crash in all 3 cohorts) Prob (all cohorts crashing) > Prob (only 1 or 2 cohorts crashing)
Thank you for your attention InputSelections Matching Procedure StockPerformance AnalystEstimates OLSRegression RobustnessCheck Objectives Conclusions