Download
1 / 1
10 likes | 85 Views
9 .21(km/s ). INTRODUCTION. DATA & RESULTS. Our Results. H I Survey.

E N D
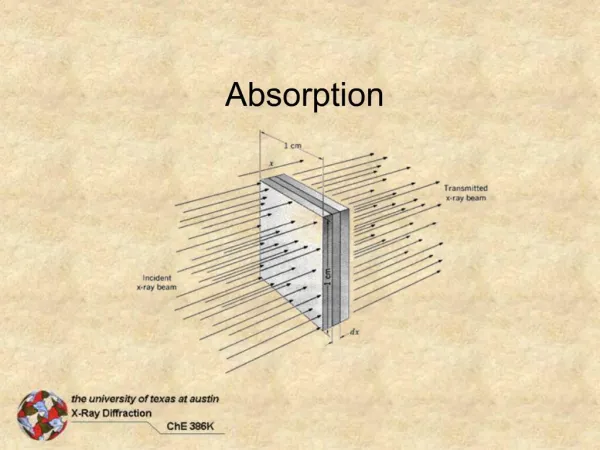
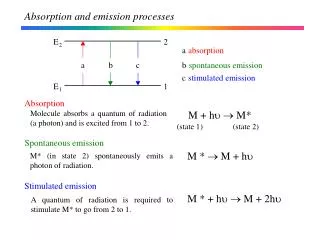
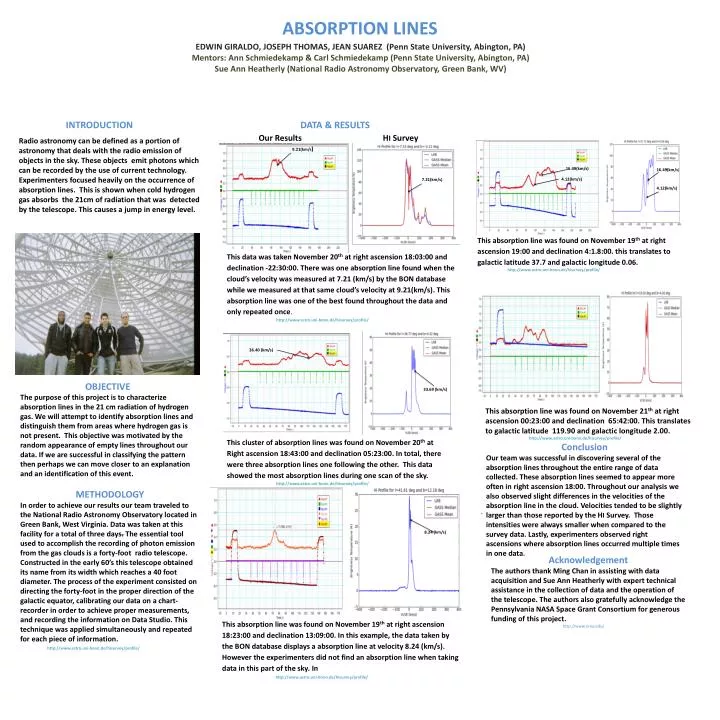
9.21(km/s) INTRODUCTION DATA & RESULTS Our Results HI Survey Radio astronomy can be defined as a portion of astronomy that deals with the radio emission of objects in the sky. These objects emit photons which can be recorded by the use of current technology. Experimenters focused heavily on the occurrence of absorption lines. This is shown when cold hydrogen gas absorbs the 21cm of radiation that was detected by the telescope. This causes a jump in energy level. 16.49(km/s) 16.49(km/s) 7.21(km/s) 4.12(km/s) 4.12(km/s) This absorption line was found on November 19th at right ascension 19:00 and declination 4:1.8:00. this translates to galactic latitude 37.7 and galactic longitude 0.06. This data was taken November 20th at right ascension 18:03:00 and declination -22:30:00. There was one absorption line found when the cloud’s velocity was measured at 7.21 (km/s) by the BON database while we measured at that same cloud’s velocity at 9.21(km/s). This absorption line was one of the best found throughout the data and only repeated once. ABSORPTION LINES http://www.astro.uni-bonn.de/hisurvey/profile/ 36.40 (km/s) http://www.astro.uni-bonn.de/hisurvey/profile/ 33.69 (km/s) This absorption line was found on November 21th at right ascension 00:23:00 and declination 65:42:00. This translates to galactic latitude 119.90 and galactic longitude 2.00. OBJECTIVE The purpose of this project is to characterize absorption lines in the 21 cm radiation of hydrogen gas. We will attempt to identify absorption lines and distinguish them from areas where hydrogen gas is not present. This objective was motivated by the random appearance of empty lines throughout our data. If we are successful in classifying thepattern then perhaps we can move closer to an explanation and an identification of this event. This cluster of absorption lines was found on November 20th at Right ascension 18:43:00 and declination 05:23:00. In total, there were three absorption lines one following the other. This data showed the most absorption lines during one scan of the sky. EDWIN GIRALDO, JOSEPH THOMAS, JEAN SUAREZ (Penn State University, Abington, PA) Mentors: Ann Schmiedekamp & Carl Schmiedekamp(Penn State University, Abington, PA) Sue Ann Heatherly (National Radio Astronomy Observatory, Green Bank, WV) http://www.astro.uni-bonn.de/hisurvey/profile/ Conclusion Our team was successful in discovering several of the absorption lines throughout the entire range of data collected. These absorption lines seemed to appear more often in right ascension 18:00. Throughout our analysis we also observed slight differences in the velocities of the absorption line in the cloud. Velocities tended to be slightly larger than those reported by the HI Survey. Those intensities were always smaller when compared to the survey data. Lastly, experimenters observed right ascensions where absorption lines occurred multiple times in one data. http://www.astro.uni-bonn.de/hisurvey/profile/ METHODOLOGY In order to achieve our results our team traveled to the National Radio Astronomy Observatory located in Green Bank, West Virginia. Data was taken at this facility for a total of three days. The essential tool used to accomplish the recording of photon emission from the gas clouds is a forty-foot radio telescope. Constructed in the early 60’s this telescope obtained its name from its width which reaches a 40 foot diameter. The process of the experiment consisted on directing the forty-foot in the proper direction of the galactic equator, calibrating our data on a chart-recorder in order to achieve proper measurements, and recording the information on Data Studio. This technique was applied simultaneously and repeated for each piece of information. . 8.24 (km/s) Acknowledgement The authors thank Ming Chan in assisting with data acquisition and Sue Ann Heatherly with expert technical assistance in the collection of data and the operation of the telescope. The authors also gratefully acknowledge the Pennsylvania NASA Space Grant Consortium for generous funding of this project. This absorption line was found on November 19th at right ascension 18:23:00 and declination 13:09:00. In this example, the data taken by the BON database displays a absorption line at velocity 8.24 (km/s). However the experimenters did not find an absorption line when taking data in this part of the sky. In http://www.nrao.edu/ http://www.astro.uni-bonn.de/hisurvey/profile/ http://www.astro.uni-bonn.de/hisurvey/profile/