Download
1 / 79
790 likes | 880 Views
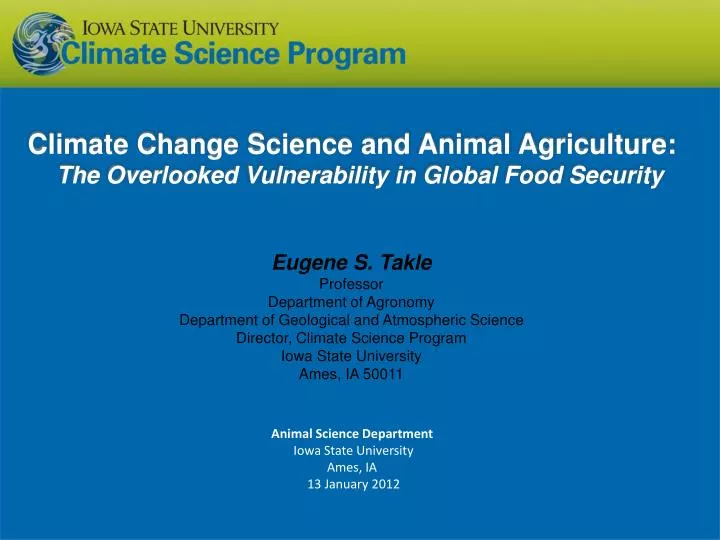
Climate Change Science and Animal Agriculture: The Overlooked Vulnerability in Global Food Security. Eugene S. Takle Professor Department of Agronomy Department of Geological and Atmospheric Science Director, Climate Science Program Iowa State University Ames, IA 50011.

E N D
Climate Change Science and Animal Agriculture: The Overlooked Vulnerability in Global Food Security Eugene S. Takle Professor Department of Agronomy Department of Geological and Atmospheric Science Director, Climate Science Program Iowa State University Ames, IA 50011 Animal Science Department Iowa State University Ames, IA 13 January 2012
For a copy of this presentation… • See me afterwards, or • Google • Eugene Takle • and go to: • Public Powerpoint • Presentations
Outline • Observed global changes in carbon dioxide and temperature • Projected future changes in global and US temperatures and precipitation • Adaptation to climate change already is happening • Animal agriculture and climate change • Overlooked?
Climate change is one of the most important issues facing humanity The scientific evidence clearly indicates that our climate is changing, and that human activities have been identified as a dominant contributing cause.
Three separate analyses of the temperature record – Trends are in close agreement
Three separate analyses of the temperature record – Trends are in close agreement Richard Muller, UC Berkeley physicist and climate skeptic analyzed 1.9 billion temperature observations over 39,000 locations and concluded that NOAA, NASA, and HadCRU got it right. Wall Street Journal Oct 2011
Temperature Changes are Not Uniform Around the Globe From Tom Karl, NOAA NCDC
Conditions today are unusual in the context of the last 2,000 years … Don Wuebbles
Warming of the Lower and Upper Atmosphere Produced by Natural and Human Causes Karl, T. R., J. M. Melillo, and T. C. Peterson, (eds.), 2009: Global Climate Change Impacts in the United States. Cambridge University Press, 2009, 196pp.
Warming of the Lower and Upper Atmosphere Produced by Natural and Human Causes Note that greenhouse gases have a unique temperature signature, with strong warming in the upper troposphere, cooling in the lower stratosphere and strong warming at the surface over the North Pole. No other warming factors have this signature. Karl, T. R., J. M. Melillo, and T. C. Peterson, (eds.), 2009: Global Climate Change Impacts in the United States. Cambridge University Press, 2009, 196pp.
Warming of the Lower and Upper Atmosphere Produced by Natural and Human Causes Note that greenhouse gases have a unique temperature signature, with strong warming in the upper troposphere, cooling in the lower stratosphere and strong warming at the surface over the North Pole. No other warming factors have this signature. Karl, T. R., J. M. Melillo, and T. C. Peterson, (eds.), 2009: Global Climate Change Impacts in the United States. Cambridge University Press, 2009, 196pp.
Warming of the Lower and Upper Atmosphere Produced by Natural and Human Causes Note that greenhouse gases have a unique temperature signature, with strong warming in the upper troposphere, cooling in the lower stratosphere and strong warming at the surface over the North Pole. No other warming factors have this signature.
Climate models: Natural processes do not account for observed 20th century warming after 1965
We have Moved Outside the Range of Historical Variation 800,000 Year Record of Carbon Dioxide Concentration Don Wuebbles
What can we expect in the future? Don Wuebbles
December-January-February Temperature Change 7.2oF 6.3oF A1B Emission Scenario 2080-2099 minus1980-1999
June-July-August Temperature Change 4.5oF 5.4oF A1B Emission Scenario 2080-2099 minus1980-1999
June-July-August Temperature Change 4.5oF 5.4oF A1B Emission Scenario 2080-2099 minus1980-1999 Not the direction of current trends
Projected Change in Precipitation: 2081-2099 Midwest: Increasing winter and spring precipitation, with drier summers More frequent and intense periods of heavy rainfall Unstippled regions indicate reduced confidence Relative to 1960-1990 NOTE: Scale Reversed Don Wuebbles
First Date Iowa’s Average Fall 4-inch Soil Temperature Was Below 50oF Iowa Environmental Mesonet2010
Des Moines Airport Data Caution: Not corrected for urban heat island effects
Des Moines Airport Data Caution: Not corrected for urban heat island effects
Des Moines Airport Data 1983: 13 1988: 10 1977: 8 1974: 7 2011: 0
Des Moines Airport Data 1983: 13 1988: 10 1977: 8 1974: 7 6 days ≥ 100oF in the last 23 years 2011: 0
Iowa State-Wide Average Data 34.0” 10% increase 30.8”
Iowa State-Wide Average Data Totals above 40” 2 years 34.0” 10% increase 30.8”
Iowa State-Wide Average Data Totals above 40” 8 years 2 years 34.0” 10% increase 30.8”
Cedar Rapids Data 32% increase 28.0” 37.0”
Cedar Rapids Data Years with more than 40 inches 11 1 32% increase 28.0” 37.0”
“One of the clearest trends in the United States observational record is an increasing frequency and intensity of heavy precipitation events… Over the last century there was a 50% increase in the frequency of days with precipitation over 101.6 mm (four inches) in the upper midwestern U.S.; this trend is statistically significant “ Karl, T. R., J. M. Melillo, and T. C. Peterson, (eds.), 2009: Global Climate Change Impacts in the United States. Cambridge University Press, 2009, 196pp.
Cedar Rapids Data 67% increase 3.6days 6.0 days
Cedar Rapids Data Number of Years with More than 8 Occurrences 0 9 67% increase 3.6days 6.0 days
Years with more than 40 inches: 43% Increase 2010 so far
3.7 41% Increase 5.2
Number of Years with More than 8 Occurrences 2 7 3.7 41% Increase 5.2
Amplification of the Seasonality of Precipitation Spring Fall Winter Summer
Amplification of the Seasonality of Precipitation Spring Fall Winter Summer
Amplification of the Seasonality of Precipitation Spring Fall 21.2 => 25.3 inches (22% increase) 12.1 => 10.5 inches (13% decrease) Winter Summer
Climate trends of the recent past have low statistical significance. Nevertheless, they have forced significant adaptation for Iowa farmers and communities:
Climate trends of the recent past have low statistical significance. Nevertheless, they have forced significant adaptation for Iowa farmers and communities: Even climate trends of low statistical significance can have impacts of high significance to Iowa agriculture and communities