Download
1 / 10

E N D
1. Measures of central tendency and dispersion
2. Measures of central tendency Mean
Median
Mode
ie finding a �typical� value from the middle of the data.
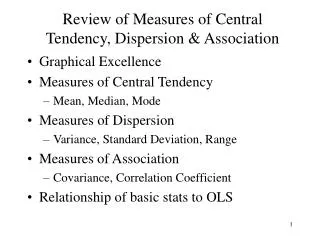
3. You need to be able to: Explain how to calculate the mean, median and mode
State the strengths and weaknesses of mean, median and mode
This could include saying which one you would use for some data e.g. 2, 2, 3, 2, 3, 2, 3, 2, 97 - would you use mean or median here?
4. Advantages and disadvantages
5. Measures of Dispersion Measures of �spread�
This looks at how �spread out� the data are.
Are the scores similar to each other (closely clustered), or quite spread out?
6. Range and standard deviation The range is the difference between the highest and lowest numbers. What is the range of �
3, 5, 8, 8, 9, 10, 12, 12, 13, 15
Mean = 9.5 range = 12 (3 to 15)
1, 5, 8, 8, 9, 10, 12, 12, 13, 17
Mean = 9.5 range = 16 (1 to 17)
Example from Cara Flanagan, Research Methods for AQA A Psychology (2005) Nelson Thornes p 15
7. Standard deviation Standard deviation tells us the average distance of each score from the mean.
68% of normally distributed data is within 1 sd each side of the mean
95% within 2 sd
Almost all is within 3 sd
8. Example Mean IQ = 100, sd = 15
What is the IQ of 68% of population (ie what is the range of possible IQs)?
Between what IQ scores would 95% of people be?
Dan says he has done an online IQ test, and he has an IQ of 170. Should you believe him? Why/not?
9. Another example Sol scores 61% in the test. His mum says that�s rubbish. Sol points out that the mean score in class was 50%, with an sd of 5. Did he do well?
What if the sd was only 2?
What if sd was 15?
10. Advantages and disadvantages