Download
1 / 25
340 likes | 628 Views
Tripartite 2008 Beijing 8-9 November. Ship efficiency over time and slow steaming. Ship efficiency. Question: Have ship become more efficient over time?. SFOC for Diesel Engines. Fuel consumption trends. Statement: When freight rates are low: Yards have thin order books

E N D
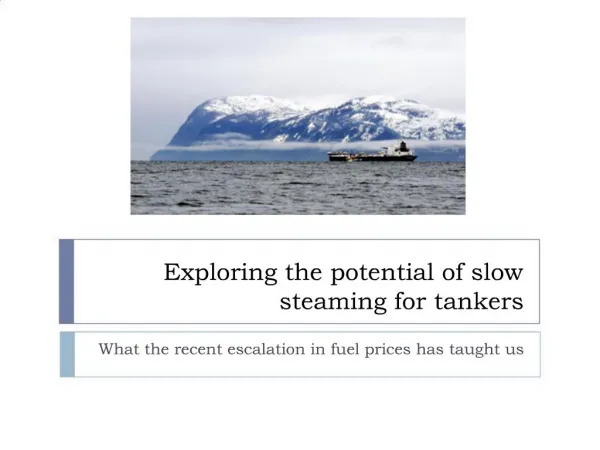
Tripartite 2008 Beijing 8-9 November Ship efficiency over time and slow steaming
Ship efficiency Question: Have ship become more efficient over time?
Fuel consumption trends • Statement: • When freight rates are low: • Yards have thin order books • Competition between yards tough • Innovative designs win the day • When freight rates are high: • Owners queue up to order ships • Yards reluctant to change Standard Designs • No incentive for innovation
Fuel consumption trends • Early 1980’s to early 1990’s: • A few ups and downs but otherwise a relatively stable period. • Early 1990’s to 2002 (incl. Asian Crises 1997): • Poor freight rates. • Tough times for the yards • Many EU yards close • 2002-2008: • High freight rates • Ordering boom • New yards emerge • Emphasis on cargo intake
Fuel consumption trends • In 2008 the Shipping Industry initiated a study on fuel trends. • Lloyd’s Register Marine Consultancy Services carried out the study. • Following ships were used:
Fuel consumption trends • Following formulas were used to calculate the fuel consumption and related Energy Efficiency Index:
Historical trend - Containerships • Example – Economy of Scale: • Sealand SL-7 vs. Maersk E-type • Sealand McClean: Built 1973 1968 TEU 88 MW 31 knots 450 t HFO/24h (Steam turbine) • Emma Maersk: Built 2006 15,000 TEU 80 MW (88 MW incl. shaft motor) 25 knots 350t HFO/24h (Diesel engine)
Emma vs. McClean • Energy Efficiency Index: • SL-7: 950 g CO2/TEU*NM • Maersk E-type: 115 g CO2/TEU*NM • New 2000 TEU: 270 g CO2/TEU*NM
Slow Steaming • 8000 TEU Containership: • Reduce speed from 25kn -> 20kn = 20% => • Fuel saving from 260 t/d –> 128 t/d = 51%
Slow Steaming Scenario: Move 10 mill TEU 5000 NM within one year (250 sailing days): Transport work: 50 billion TEU*Miles An infinite number of 8000 TEU ships available!
Slow Steaming CO2 Index
Slow Steaming Paper for WMTC Mumbai January 2009: • Optimized speed from a economical viewpoint, considering: - Capital Cost - Operating Cost - Voyage Cost • On a route between Ningbo (China) and Bremerhaven (Germany) with a 6600 TEU containership the study gives an optimized speed of 17 kn (compared to 24 kn).
Ship efficiency Questions?