Download
1 / 1
10 likes | 81 Views
DC EXPERIMENTS. AC EXPERIMENTS. +. Raw experimental data, P bend has coupling loss due to Fresnel reflections and scattering at the end waveguide surfaces. This loss is calibrated out by subtracting the power of a straight waveguide P str1 to give the normalized power P norm1 as:. -.

E N D
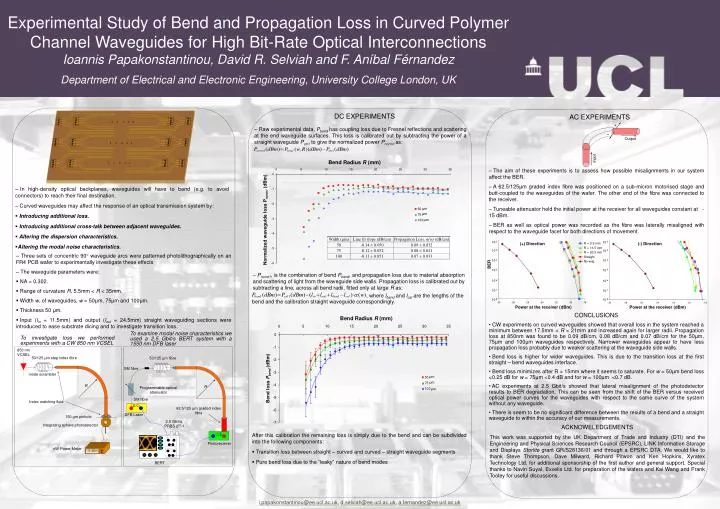
DC EXPERIMENTS AC EXPERIMENTS + • Raw experimental data, Pbend has coupling loss due to Fresnel reflections and scattering at the end waveguide surfaces. This loss is calibrated out by subtracting the power of a straight waveguide Pstr1 to give the normalized power Pnorm1 as: - Output Input Bend Radius R (mm) • The aim of these experiments is to assess how possible misalignments in our system affect the BER. • A 62.5/125μm graded index fibre was positioned on a sub-micron motorised stage and butt-coupled to the waveguides of the wafer. The other end of the fibre was connected to the receiver. • Tuneable attenuator held the initial power at the receiver for all waveguides constant at -15 dBm. • BER as well as optical power was recorded as the fibre was laterally misaligned with respect to the waveguide facet for both directions of movement. 10-2 10-3 • In high-density optical backplanes, waveguides will have to bend (e.g. to avoid connectors) to reach their final destination. • Curved waveguides may affect the response of an optical transmission system by: • Introducing additional loss. • Introducing additional cross-talk between adjacent waveguides. • Altering the dispersion characteristics. • Altering the modal noise characteristics. 10-4 10-5 μm 10-6 μm Normalized waveguide loss Pnorm1 (dBm) 10-7 μm 10-8 10-2 (+) Direction (-) Direction 10-3 • Three sets of concentric 90° waveguide arcs were patterned photolithographically on an FR4 PCB wafer to experimentally investigate these effects • The waveguide parameters were: • NA = 0.302. • Range of curvature R, 5.5mm < R < 35mm. • Width w, of waveguides, w = 50μm, 75μm and 100μm. • Thickness 50 μm. • Input (lin = 11.5mm) and output (lout = 24.5mm) straight waveguiding sections were introduced to ease substrate dicing and to investigate transition loss. 10-4 BER 10-5 10-6 • Pnorm1, is the combination of bend Pbend, and propagation loss due to material absorption and scattering of light from the waveguide side walls. Propagation loss is calibrated out by subtracting a line, across all bend radii, fitted only at large R as: 10-7 10-8 , where lbend and lcalare the lengths of the Power at the receiver (dBm) Power at the receiver (dBm) bend and the calibration straight waveguide correspondingly. Bend Radius R (mm) • CONCLUSIONS • CW experiments on curved waveguides showed that overall loss in the system reached a minimum between 17.5mm < R < 21mm and increased again for larger radii. Propagation loss at 850nm was found to be 0.09 dB/cm, 0.08 dB/cm and 0.07 dB/cm for the 50μm, 75μm and 100μm waveguides respectively. Narrower waveguides appear to have less propagation loss probably due to weaker scattering at the waveguide side walls. • Bend loss is higher for wider waveguides. This is due to the transition loss at the first straight – bend waveguides interface. • Bend loss minimizes after R > 15mm where it seems to saturate. For w = 50μm bend loss <0.25 dB for w = 75μm <0.4 dB and for w = 100μm <0.7 dB. • AC experiments at 2.5 Gbit/s showed that lateral misalignment of the photodetector results to BER degradation. This can be seen from the shift of the BER versus received optical power curves for the waveguides with respect to the same curve of the system without any waveguide. • There is seem to be no significant difference between the results of a bend and a straight waveguide to within the accuracy of our measurements. To examine modal noise characteristics we used a 2.5 Gbit/s BERT system with a 1550 nm DFB laser To investigate loss we performed experiments with a CW 850 nm VCSEL 850 nm VCSEL 50/125 μm step index fibre 50/125 μm fibre SM fibre Bend loss Pbend (dBm) μm mode scrambler μm μm R R Programmable optical attenuator SM fibre Index matching fluid E/O 62.5/125 μm graded index fibre DFB Laser 150 μm pinhole 2.5 Gbit/s, PRBS 233-1 Integrating sphere photodetector ACKNOWELEDGEMENTS This work was supported by the UK Department of Trade and Industry (DTI) and the Engineering and Physical Sciences Research Council (EPSRC), LINK Information Storage and Displays Storlite grant GR/S28136/01 and through a EPSRC DTA. We would like to thank Steve Thompson, Dave Milward, Richard Pitwon and Ken Hopkins, Xyratex Technology Ltd. for additional sponsorship of the first author and general support. Special thanks to Navin Suyal, Exxelis Ltd. for preparation of the wafers and Kai Wang and Frank Tooley for useful discussions. After this calibration the remaining loss is simply due to the bend and can be subdivided into the following components: • Transition loss between straight – curved and curved – straight waveguide segments • Pure bend loss due to the “leaky” nature of bend modes O/E -15 dBm nW Power Meter BERT Experimental Study of Bend and Propagation Loss in Curved Polymer Channel Waveguides for High Bit-Rate Optical Interconnections Ioannis Papakonstantinou, David R. Selviah and F. Aníbal Férnandez Department of Electrical and Electronic Engineering, University College London, UK Photoreceiver i.papakonstantinou@ee.ucl.ac.uk, d.selviah@ee.ucl.ac.uk, a.fernandez@ee.ucl.ac.uk