1 / 1

Figure 1a. Distribution of homocysteine according to folate fractional excretion tertiles

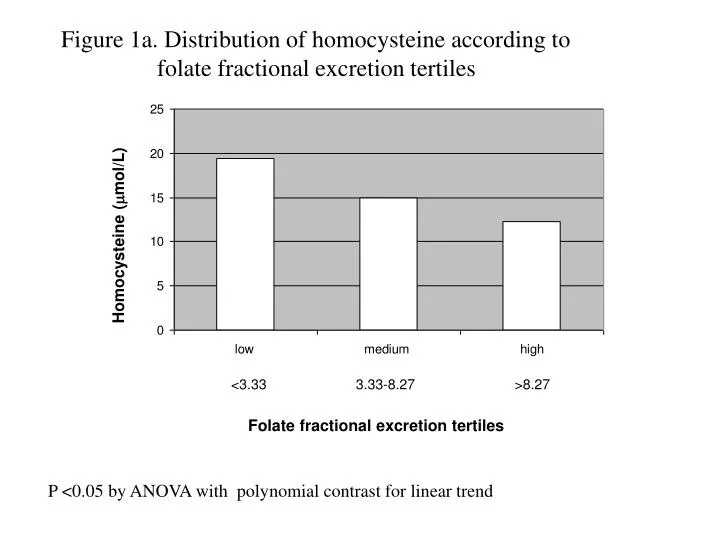
Figure 1a. Distribution of homocysteine according to folate fractional excretion tertiles. Homocysteine ( m mol/L). <3.33. 3.33-8.27. >8.27. Folate fractional excretion tertiles. P <0.05 by ANOVA with polynomial contrast for linear trend.

thora
Download Presentation

Figure 1a. Distribution of homocysteine according to folate fractional excretion tertiles

An Image/Link below is provided (as is) to download presentation Download Policy: Content on the Website is provided to you AS IS for your information and personal use and may not be sold / licensed / shared on other websites without getting consent from its author. Content is provided to you AS IS for your information and personal use only. Download presentation by click this link. While downloading, if for some reason you are not able to download a presentation, the publisher may have deleted the file from their server. During download, if you can't get a presentation, the file might be deleted by the publisher.

E N D

Presentation Transcript


  1. Figure 1a. Distribution of homocysteine according to folate fractional excretion tertiles Homocysteine (mmol/L) <3.33 3.33-8.27 >8.27 Folate fractional excretion tertiles P <0.05 by ANOVA with polynomial contrast for linear trend

More Related