Download

1 / 26
260 likes | 402 Views
Composite MRI scores improve correlation with EDSS in multiple sclerosis by Poonawalla et al. Review by Jason Su. Introduction and Methods. Looking for a composite measure that correlates well with EDSS

E N D
Composite MRI scores improve correlation with EDSS in multiple sclerosis by Poonawalla et al. Review by Jason Su
Introduction and Methods • Looking for a composite measure that correlates well with EDSS • North American Linomide Trial used volume of Gd lesions, T1 lesion volume, total lesion volume, and CSF volume fraction: distinguishes groups at 3 months but poor correlation (r = 0.146) • Build new composite based on T2 relaxation mapping • 3T, N=126 RRMS (101:25 F:M), aged 2-64, EDSS 0-6.5 • dFSE for T2 mapping • FLAIR and T1-weighted SE pre and post Gd • 256x256 in-plane, 3mm slice
Methods: Processing • Auto image segmentation for WM, GM, T2 lesions, T1 lesions, and enhancing lesions • Based on Texas Medical School papers • Normalized each feature to 0 mean and unit variance (“z-transformation”) • Searched for combination of 2-4 features with good correlation to EDSS, equal weighting/no regression • Want individual high correlation with EDSS • Low cross-correlation between features
Results • BH and BOD correlate the most with EDSS • But seem to carry same information, low improvement together • Normalized CSF has low cross-correlation • Volumetric composite does well and when combined with T2 mapping • T2 values alone do poorly • T2 values in black hole seem more diverse than T2 lesions
Discussion • Correlation may be limited because EDSS is discrete valued and non-cognitive based • RR-only population may also have an effect, limited EDSS range • Perhaps a different composite for each subtype is a good idea • Authors have previously shown that correlation decreases with population study size • r=0.344 is better than any other study of similar size and seemed more robust with size • Black hole volume and T2 values were most important • Working on multicenter, longitudinal, and MSFC next
Criticisms • Really would have liked to see regression, i.e. weighting of the variables • Makes little sense to treat them as all having an equal effect • F-tests to show significant improvement in nested models • Built composites using (cross-)correlation tables as a guide, but could have done something more thorough • Stepwise or exhastive model selection
Imaging Biomarkers in Multiple Sclerosis by Filippi and Agosta
Introduction • Conventional MR has limited specificity to look at all the processes involved: edema, demyelination, remyelination, gliosis and axonal loss • Atrophy measures • MT • DTI • H-MRS • fMRI • T2 hyperintense lesions, T1 hypointense and/or enhancing, and cervical spinal cord lesions typically studied
MS Criteria • McDonald • Dissemination in space: 9 T2 lesions can include spinal cord • Dissemination in time: new lesions within 30 days • Swanton – more lax • A T2 lesion in at least 2 of 4 major regions (juxtacortical, periventricular, infratentorial, and cord) • Any new T2 lesion in a follow up, time scale doesn’t matter • More sensitive and still specific compared to McDonald
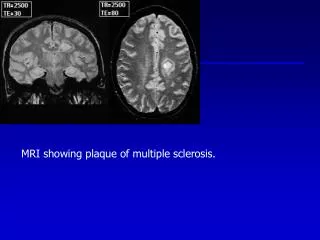
Lesion Imaging • T2-weighted imaging cannot see GM lesions • Dual inversion recovery to suppress CSF and WM improves visibility of WM and GM lesions
Pre-MS • # and extent of T2 and T1 lesions relevant at onset, predict disability 6 months later • MTR lower in NAWM for CIS, correlated with MSFC and Paced Auditory Serial Addition Task but not predictive • DTI not predictive but tractography shows increased MD in corticospinal tract with motor impairment • Similar observations for optic neuritis and optic nerve • H-MRS shows NAA lower than in control • Increased myoinositol (mI) and creatine in NAWM, meaning early widespread axonal pathology and increase in cell turnover is common • Not much longitudinal correlation
Pre-MS • GM • MTR has mixed results • MD increases with time but no associated clinical disability • Increased iron in left caudate reducing T2 signal but not associated with progression to MS • GM atrophy seems greater than WM over 3 yrs. • Optic neuritis • FSE T2w and SE T1 with Gd imaging can usually find the causative lesion • MTR useful for tracking changes, starts high (inflammation) then becomes low as more damage vs. normal • DTI has strong correlation with visual acuity and predictive
Definite MS - Lesions • T2 lesion load higher in SPMS, only some correlation for low EDSS < 4.5 • PPMS more diffuse involvement of cortical and subcortical regions • Higher probability of lesions in PP vs. RR in age and duration matched study • Enhancing • Less enhancing lesions in SP than RR • Increase associated with relapse, predicts MRI activity • SP accumulate more cortical lesions than CIS or RR, also associated with PP and epilepsy, but need more sensitive sequences
Definite MS - Lesions • New contrast agents like ultra small particles of iron oxide to track macrophages • MTR higher in homogenously enhancing vs. ring and triple vs. single dose of Gd • DTI less clear, FA lower in enhancing but MD mixed results • Tracking lesions over 3 months: only a subgroup had increasing MD, MD correlated with T1 hypointensity • H-MRS shows increased choline and lactate • Glutamate also elevated, ineffective removal due to oligodenrocyte loss • NAA significant decrease for RR, SP, and PP, inversely correlated with lesions • Lac returns to normal over a week, Cho and NAA over months • Relative proportion of T2 lesions with severe intrinsic damage probably relevant to disability • Lesion MTR lower in RR than CIS, similarly for SP and PP vs. RR even for new lesions • Average lesion MTR change after 12 months predicts disability over next 8 yrs.
Definite MS – NAWM & NABT • Reduced MTR, increased MD, and lower NAA before lesions appear on T2w • MTR NAWM more correlated with cognitive disability than lesions • Predictive of disability over 5 yrs. • DTI more sensitive for later stages • Lower NAWM FA correlated with GM atrophy • Tractography more difficult in patients, pathology makes uncertainty in primary eigenvector of DT • Corticospinal tracts different for patients • Higher MD in CC for cognitively impaired • FA useful in optic radiation damage • NAA drops more in NAWM for SP and PP
Definite MS – GM • Lower MTR in GM for progressive patients • Lower for cognitively impaired in benign MS • Predictive of disability in relapsing-onset MS • MTR decline reflected rate of clinical deterioration • Regional correlations with EDSS and PASAT • SP more severe DTI changes than PP • GM diffusivity predictive of disability for PP • Abnormalities in thalamus for RR and SP • Lower NAA and Cho, increased mI especially for progressive • NAA lower in thalamus for SP and RR and cortex for PP • Lower Glu-glutamine in PP cortex, correlated with EDSS • Iron deposition may be cause of T2 hypointense regions and lower T2 times • GM damage only partially correlated with WM lesions
Definite MS – Atrophy • Important for later stages • 0.5-1% brain volume loss per year vs. 0.1-0.3% in control • Significant brain volume loss in all definite MS but rate seems independent of subtype • Frontal, temporal, and parietal lobes most atrophic GM regions, involved in progressive disability • Atrophy as a result of demyelination still not known • Volume loss at early stages predicts disability at follow up • Greater GM atrophy rate in RR, RR who progress, and SP, 8-14x normal • WM atrophy same in these groups, 3x normal • Better correlated with cognitive impairment than lesions, esp. cortical • Thalamus atrophy in pediatric MS
Definite MS – Functional • Consistent natural course for functional reorganization of cortex in MS • Recruiting larger areas for later stages of disease • Less recruitment in recovering patients • Movement and cognitive fMRI correlated with NAWM, GM, and cervical cord injury • Measures of functional connectivity and tract damage to improve understanding of connection between structural and functional abnormalities
Definite MS – Spinal Cord • Lesions in 90% of cases • Seems independent of brain atrophy • Correlates better with EDSS than lesion load • MTR in cord correlates with relapse rate and EDSS change over 18 months • Value of DTI and MT in long follow-ups not yet established • FA decreased and MD increased in 2.4 yr. follow up
Future Biomarkers • New contrast agents • Target inflammation or neuronal dysfunction • Myeloperoxidase to image inflammation • Gado-fluorine M accumulates in Wallerian degeneration • 7T+ MR • Some lesions show distinct rings on phase images • Cortical lesions more visible • 3 types have been established in imaging, comparable to histology • Increased susceptibility in caudate, putamen, and globuspallidus, correlated with disease duration • MRS, new metabolites under study
Future Biomarkers • Myelin imaging • MWF loss in NAWM dominated by myelin integrity loss, not edema or inflammation • Perfusion • Changes in lesions, NAWM, and deep GM • Findings in CC of RRMS looks more like primary ischemia than Wallerian degeneration • Spinal cord • Quantitative methods being applied here • MT shows damage in GM of cord for RR
Take Away Message • Cognitive tests like MSFC and PASAT are seeing more use • Predicting progression to MS or SP remains a challenge • Understanding and imaging all the physical processes at play is vital • It is becoming more apparent that GM degeneration has a large effect on disability