Download
1 / 67
670 likes | 683 Views
C. 7. hapter. Inventories: Cost Measurement and Flow Assumptions. An electronic presentation by Douglas Cloud Pepperdine University. Objectives. 1. Describe how inventory accounts are classified. 2. Explain the uses of perpetual and periodic inventory systems.

E N D
C 7 hapter Inventories: Cost Measurement and Flow Assumptions An electronic presentation by Douglas Cloud Pepperdine University
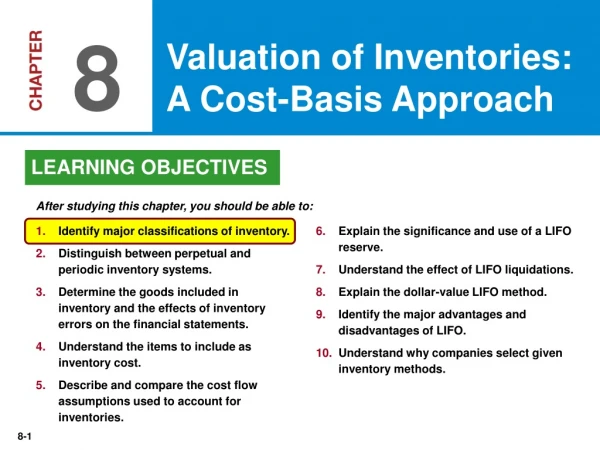
Objectives 1. Describe how inventory accounts are classified. 2. Explain the uses of perpetual and periodic inventory systems. 3. Identify how inventory quantities are determined. 4. Determine the cost of inventory. 5. Compute ending inventory and cost of goods sold under specific identification, FIFO, average cost, and LIFO. Continued
Objectives 6. Explain the conceptual issues regarding alternative inventory cost flow assumptions. 7. Understand dollar-value LIFO. 8. Explain additional LIFO issues. 9. Understand inventory disclosures. 10. Record foreign currency transactions involving inventory (Appendix).
Accounts Payable (or Cash) Merchandise Inventory Cost of Goods Sold Goods Purchased Goods Sold Flow of Inventory Costs Merchandising Company
Accounts Payable (or Cash) Raw Materials Inventory To Goods in Process Inventory Materials Purchased Materials Used in Production Flow of Inventory Costs Manufacturing Company Continued
Direct Labor To Goods in Process Inventory Actual Direct Labor Labor Charged to Production Manufacturing (Factory) Overhead To Goods in Process Inventory Actual Mfg. Over-head Overhead Applied to Production Flow of Inventory Costs Manufacturing Company Continued
Goods in Process Inventory Finished Goods Inventory Materials Used Direct Labor Overhead Applied Goods Finished (Manufactured) Goods Sold to Cost of Goods Sold Flow of Inventory Costs Manufacturing Company
Alternative Inventory Systems A company using a perpetual systemmaintains a continuous record of the physical quantities in its inventory.
Alternative Inventory Systems A company using a periodic systemdoes not maintains a continuous record of the physical quantities on hand.
Computation of Net Purchases Purchases + Freight-in - Purchases Returns and Allowances - Purchases Discounts Taken = Net Purchases
Comparison of Systems Perpetual Inventory System Periodic Inventory System Beginning inventory + Purchases (net) - Goods Sold = Ending Inventory Beginning inventory + Purchases (net) - Ending Inventory = Goods Sold
Fruit Express FOB Shipping Point Goods being shipped included in inventory of buyer.
Fruit Express FOB Destination Goods being shipped included in inventory of seller.
Determination of Inventory Costs • Price paid or consideration given • Freight-in • Receiving • Unpacking • Inspecting • Storage • Insurance • Sales and other applicable taxes
Purchases Discounts Under the gross price method, a company records the purchase at the gross price, and records the amount of the discount in the accounting system only if the discount is taken. Under the net price method, a company records the purchase at its net price, and records the amount of the discount in the accounting system only if the discount is not taken.
Purchases Discounts A company purchases $1,000 of goods under terms of 1/10, n/30. Gross Price Method To record the purchase Inventory (or Purchases) 1,000 Accounts Payable 1,000
Purchases Discounts A company purchases $1,000 of goods under terms of 1/10, n/30. Gross Price Method To record payment within the discount period: Accounts Payable 1,000 Purchases Discounts Taken 10 Cash 990
Purchases Discounts A company purchases $1,000 of goods under terms of 1/10, n/30. Gross Price Method To record payment after the discount period: Accounts Payable 1,000 Cash 1,000 No adjusting entry is required.
Purchases Discounts A company purchases $1,000 of goods under terms of 1/10, n/30. Net Price Method To record the purchase: Inventory (or Purchases) 990 Accounts Payable 990
Purchases Discounts A company purchases $1,000 of goods under terms of 1/10, n/30. Net Price Method To record payment within the discount period: Accounts Payable 990 Cash 990
Purchases Discounts A company purchases $1,000 of goods under terms of 1/10, n/30. Net Price Method To record payment after the discount period: Accounts Payable 990 Purchases Discounts Lost 10 Cash 1,000
Purchases Discounts A company purchases $1,000 of goods under terms of 1/10, n/30. Net Price Method Adjusting entry at the end of period if discount has expired and invoice is unpaid: Purchases Discounts Lost 10 Accounts Payable 10
Specific Identification 100 units @ $10 per unit Apr. 1 Apr. 10 Apr. 20 80 units @ $11 per unit 70 units @ $12 per unit On April 27, sold 90 units from the beginning inventory and 50 units from the April 10 purchase.
= $ 100 = 330 = 840 $1,270 $1,000 + $1,720 - $1,270 = $1,450 Specific Identification Ending Inventory 10 units @ $10 per unit Apr. 1 Apr. 10 Apr. 20 30 units @ $11 per unit 70 units @ $12 per unit On April 27, sold 90 units from the beginning inventory and 50 units from the April 10 purchase. Beg. Inv. + Purchases - End. Inv. = Cost of Goods Sold
Sold all Sold 40 Sold 0 First-In, First-Out (FIFO) 100 units @ $10 per unit 0 units @ $10 per unit Apr. 1 Apr. 10 Apr. 20 80 units @ $11 per unit 40 units @ $11 per unit 70 units @ $12 per unit Sold 140 units on April 27.
The ending inventory and the cost of goods sold under perpetual and periodic FIFO are identical. 100 units @ $10 per unit 0 units @ $10 per unit Apr. 1 Apr. 10 Apr. 20 80 units @ $11 per unit 40 units @ $11 per unit 70 units @ $12 per unit $1,000 + $1,720 - $1,280 = $1,440 First-In, First-Out (FIFO) Ending Inventory = $ 0 = 440 = 840 $1,280 Sold 140 units on April 27. Beg. Inv. + Purchases - End. Inv. = Cost of Goods Sold
100 units @ $10 per unit Apr. 1 Apr. 10 Apr. 20 80 units @ $11 per unit 70 units @ $12 per unit $10.88 x 110 units = ending inventory of $1,197 $1,000 + $1,720 - $1,197 = $1,523 Average Cost Periodic System = $1,000 = 880 = 840 $2,720 250 units $2,720 250 units = $10.88 Sold 140 units during April. Beg. Inv. + Purchases - End. Inv. = Cost of Goods Sold
$1,880 180 $1,780 160 Moving Average Apr. 1 Beginning Inventory 100 units @ $10 $1,000 Apr. 10 Purchases 80 units @ $11 880 Apr. 10 Balance 180 units @ $10.44 $1,880 Apr. 18 Sales -90 units @ $10.44 -940 Apr. 18 Balance 90 units @ $10.44 $ 940 Apr. 20 Purchases 70 units @ $12 840 Apr. 20 Balance 160 units @ $11.125 $1,780 Apr. 27 Sales -50 units @ $11.125 -556 Apr. 30 Balance 110 units @ $11.125$1,224 Cost of Goods Sold (140 units) $940 + $556 $1,496 Ending Inventory (110 units @ $11.125) $1,224
Sold 0 Sold 70 Sold all Last-In, First-Out (LIFO) Periodic Inventory System 100 units @ $10 per unit Apr. 1 Apr. 10 Apr. 20 80 units @ $11 per unit 10 units @ $11 per unit 0 units @ $12 per unit 70 units @ $12 per unit Sold 140 units during April.
= $1,000 = 110 = 0 $1,110 $1,000 + $1,720 - $1,110 = $1,610 Last-In, First-Out (LIFO) Periodic Inventory System 100 units @ $10 per unit Apr. 1 Apr. 10 Apr. 20 10 units @ $11 per unit 0 units @ $12 per unit Ending inventory……………….. Sold 140 units during April. Beg. Inv. + Purchases - End. Inv. = Cost of Goods Sold
Purchased 80 Purchased 70 Sold 50 Sold 80 Sold 10 Last-In, First-Out (LIFO) Perpetual Inventory System 90 units @ $10 per unit 100 units @ $10 per unit Apr. 1 Apr. 10 Apr. 20 80 units @ $11 per unit 0 units @ $11 per unit 80 units @ $11 per unit 70 units @ $12 per unit Sold 90
= $ 900 = 0 = 240 $1,140 $1,000 + $1,720 - $1,140 = $1,580 Last-In, First-Out (LIFO) Perpetual Inventory System 90 units @ $10 per unit Apr. 1 Apr. 10 Apr. 20 0 units @ $11 per unit 20 units @ $12 per unit Ending inventory……………….. Beg. Inv. + Purchases - End. Inv. = Cost of Goods Sold
Comparison of Inventory Assumptions Cost of Goods Cost of Available Goods Ending for Sale Sold Inventory Cost Flow Assumption and Method FIFO, periodic $2,720 $1,440 $1,280 FIFO, perpetual 2,720 1,440 1,280 Weighted average 2,720 1,523 1,197 Moving average 2,720 1,496 1,224 LIFO, periodic 2,720 1,610 1,110 LIFO, perpetual 2,720 1,580 1,140
FIFO LIFO ($12) LIFO ($11) Revenue $30 $30 $30 Cost of goods sold -10-12-11 Gross profit $20 $18 $19 Holding gains (ex- cluded from income) 2 1 $20 $20 Holding Gains Comparisons Per Unit
Liquidation of LIFO Layers 2000: 2001: 2002: 2003: 10,000 units at $20 per unit = $200,00 = 132,000 = 192,000 = 120,000 $644,000 6,000 units at $22 per unit 8,000 units at $24 per unit 4,000 units at $30 per unit Inventory, January 1, 2004…………. In 2004 the company purchases 50,000 units at $35 per unit and sells 60,000 units.
Liquidation of LIFO Layers 2000: 2001: 2002: 2003: 2004: 10,000 units at $20 per unit = $200,00 = 132,000 = 192,000 = 120,000 = 1,750,000 6,000 units at $22 per unit Sold 6,000 8,000 units at $24 per unit 6,000 units at $24 per unit Sold 4,000 4,000 units at $30 per unit 4,000 units at $30 per unit Sold 50,000 50,000 units at $35 per unit 50,000 units at $35 per unit In 2004 the company purchases 50,000 units at $35 per unit and sells 60,000 units.
Liquidation of LIFO Layers 2000: 2001: 2002: 10,000 units at $20 per unit 6,000 units at $22 per unit 2,000 units at $24 per unit = $ 144,000 = 120,000 = 1,750,000 $2,014,000 6,000 units at $24 per unit 2002: 2003: 2004: 4,000 units at $30 per unit 50,000 units at $35 per unit Cost of goods sold…………
Difficulties in Applying Simple LIFO 1. The LIFO method requires a company to keep numerous detailed records. 2. Fluctuations in the physical quantities of similar inventory items may occur. 3. As technological changes take place, inventory made up with one material is replaced by inventory made with substitute materials or an outdated design is replaced by a newer design.
Dollar-Value LIFO Step 1: Value the total ending inventory at current-year costs. 01/1/03 $10,000 12/31/03 $12,100 12/31/04 $13,125 12/31/05 $16,800 12/31/06 $12,360
Dollar-Value LIFO Step 2: Convert (roll back) the ending inventory cost to base-year cost: 12/31/03 $12,100 12/31/04 $13,125 12/31/05 $16,800 12/31/06 $12,360 x 100/110 = $11,000 x 100/125 = $10,500 x 100/140 = $12,000 x 100/120 = $10,300 Base Year Cost Index Ending Inventory at Current Cost 12/31/03 x Current Cost Index
1/1/00 Dollar-Value LIFO Step 3: Compute the change in the inventory level for the year at base-year costs. $11,000 - $10,000 12/31/03 12/31/04 12/31/05 12/31/06 $11,000 $10,500 $12,000 $10,300 $1,000 Base year, $10,000 12/31/03
$11,100 Ending inventory, 12/31/03 Dollar-Value LIFO Step 4a: If there has been an increase, convert this increase to current-year costs. $1,000 x 110/100 = $ 1,100 x 100/100 = 10,000 Base year, $10,000 12/31/03
Dollar-Value LIFO Step 2: Convert the ending inventory cost to base-year cost: 12/31/03 $12,100 12/31/04 $13,125 12/31/05 $16,800 12/31/06 $12,360 x 100/110 = $11,000 x 100/125 = $10,500 x 100/140 = $12,000 x 100/120 = $10,300 Base Year Cost Index Ending Inventory at Current Cost 12/31/04 x Current Cost Index
Dollar-Value LIFO Step 3: Compute the change in the inventory level for the year at base-year costs. 12/31/03 12/31/04 12/31/05 12/31/06 $11,000 $10,500 $12,000 $10,300 $11,000 - $10,500 $1,000 Base year, $10,000 12/31/04
Dollar-Value LIFO Step 3: Compute the change in the inventory level for the year at base-year costs. 12/31/03 12/31/04 12/31/05 12/31/06 $11,000 $10,500 $12,000 $10,300 $500 Base year, $10,000 12/31/04
$10,550 Ending inventory, 12/31/04 Dollar-Value LIFO Step 4b: If there is a decrease, this decrease reduces the inventory. $500 x 110/100 = $ 550 x 100/100 = 10,000 Base year, $10,000 12/31/04
Dollar-Value LIFO Step 2: Convert the ending inventory cost to base-year cost: 12/31/03 $12,100 12/31/04 $13,125 12/31/05 $16,800 12/31/06 $12,360 x 110/100 = $11,000 x 100/125 = $10,500 x 100/140 = $12,000 x 100/120 = $10,300 Base Year Cost Index Ending Inventory at Current Cost 12/31/05 x Current Cost Index
Dollar-Value LIFO Step 3: Compute the change in the inventory level for the year at base-year costs. 12/31/03 12/31/04 12/31/05 12/31/06 $11,000 $10,500 $12,000 $10,300 $12,000 - $10,500 = $1,500 $500 Base year, $10,000 12/31/05
Dollar-Value LIFO Step 3: Compute the change in the inventory level for the year at base-year costs. 12/31/03 12/31/04 12/31/05 12/31/06 $11,000 $10,500 $12,000 $10,300 $1,500 $500 Base year, $10,000 12/31/05
Ending inventory, 12/31/05 Dollar-Value LIFO Step 4a: Convert increase to current-year costs. $1,500 x 140/100 = $ 2,100 x 110/100 = 550 x 100/100 = 10,000 $12,650 $500 Base year, $10,000 12/31/05