Download
1 / 14
140 likes | 254 Views
FNCE 4070 Financial Markets and Institutions. Lecture 8 Financial Markets: A Global Overview. Financial Times: Links to “World Business in One Place” Picture. Link to the following Financial Times site to identify places shown on the previous slide. This is an interesting site:

E N D
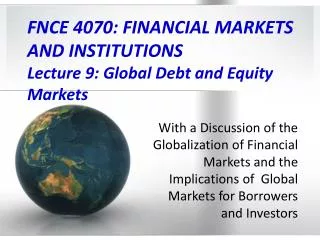
FNCE 4070Financial Markets and Institutions Lecture 8 Financial Markets: A Global Overview
Financial Times: Links to “World Business in One Place” Picture • Link to the following Financial Times site to identify places shown on the previous slide. This is an interesting site: • http://www.weliveinfinancialtimesusa.com/#
Theme of This Lecture • Overall, the United States’ financial market is larger than any other individual country. • However, we have seen a growth in both the size and role of financial markets in other countries. • In 2009, the global capital market was estimated at $232 trillion (bonds, equities and bank assets). Of this the U.S. accounted for 26%; by comparison in 2001, the U.S. accounted for 37% of the global capital market. • America’s share of the world’s aggregate stock market has fallen from 66% in 1950 to 31% in 2009. • America’s share of the world’s aggregate bond market has declined from 44% in 2001 to 34% in 2009. • America’s share of the global banking market (measured by assets) fell from 28% in 2001 to 15% in 2009. • In 2010, banks in the U.K. accounted for 37% of the turnover in foreign exchange (U.S. accounted to 18% and Japan 6%).
Global Financial Markets: 2009 • By year end 2009, global financial markets were estimated at $232.2 trillion dollars. The break down was as follows: • Stock Market Capitalization: $47.2 trillion • Debt Securities: $92.1 trillion • Of which: Public (Government) Debt $36.4 trillion • Of which: Private Debt $55.7 trillion • Bank Assets: $92.9 trillion • Note: in 2009, global financial markets were 4.1 times the size of world GDP. • Source: IMF, Global Financial Stability Report, October 2010 • http://www.imf.org/External/Pubs/FT/GFSR/2010/02/index.htm
Capital Markets by Country and Region, 2001 - 2009 2009 Total in Trillions of $ U.S. % of Total: 2001 - 2009 • World: $232.2 • U.S.: $60.9 • Japan: $24.2 • EU: $85.7 • UK: $18.2 • France: $15.8 • Germany: $12.1 • Euro Area: $62.9 • Newly Industrialized Asia* $ 9.7 • Developing Countries: $33.5 * Includes: Hong Kong, Korea, Singapore and Taiwan.
Equity Markets by Country and Region, 2001 - 2009 2009 Total in Trillions of $ U.S. % of Total: 2001 - 2009 • World: $47.2 • U.S.: $15.1 • Japan: $ 3.4 • EU: $10.0 • UK: $2.8 • France: $1.9 • Germany: $ 1.3 • Euro Area: $6.6 • Newly Industrialized Asia* $ 4.3 • Developing Countries: $ 9.9 * Includes: Hong Kong, Korea, Singapore and Taiwan.
World’s Ten Largest Stock Exchanges 1. New York Stock Exchange Country: United States Domestic Marker Cap: $ 11,837 Billion The New York Stock Exchange, the world’s largest stock exchange, is located on Wall Street, in New York, USA. The average daily trading on this stock exchange is about $ 170 Billion. It merged with the completely electronic stock exchange Euronext in 2007. Started in 1792, it was first called the New York Stock & Exchange Board. It trades in the continuous auction format, where traders act as agents and execute stock transactions on behalf of investors. The total capitalization of listed companies on the NYSE is $ 12.25 trillion. 2. Tokyo Stock Exchange Country: Japan Domestic Market Cap: $ 3,306 Billion Located in Tokyo, Japan, the Tokyo Stock Exchange has 2414 listed companies. It has a combined market capitalization of US$3.1 trillion and was founded in 1878. The London Stock Exchange (LSE) and the TSE are now developing jointly traded products and sharing technology which makes it beneficial for both economies. 3. NASDAQ Country: United States Domestic Market Cap: $ 3,239 Billion “NASDAQ” originally stood for “National Association of Securities Dealers Automated Quotations. It is the largest electronic screen-based equity securities trading market in the United States. It has more than 3800 companies listed and has the maximum trading volume as compared to any stock exchange in the world. 4. Euronext Country: Belgium, France, Holland, Portugal Domestic Market Cap: $ 2,869 Billion Euronext is a European Stock Exchange, based in Paris. It had a market capitalization of US$2.26 trillion. Its merger with NYSE made it the first electronic stock exchange. Formed in the year 2000, it has 1400 companies listed. Currently, the trading volume is USD 25 Trillion. 5. London Stock Exchange Country: United Kingdom Domestic Market Cap: $ 2,796 Billion Founded in 1801, The London Stock Exchange, is among the largest stock exchanges in the world. It has 3000 companies listed and is part of the London Stock Exchanges Group. It is also referred to as the William Morris. It has the maximum number of foreign companies listed and is completely electronic. 6. Shanghai Stock Exchange Country: China Domestic Market Cap: $ 2,704 Billion Located in Shanghai in China, the Shanghai Stock Exchange is the world’s third largest stock exchange by market capitalization at US$3.07 trillion as of May 2010. It was founded in 1891 and has 890 companies listed on it. 7. Hong Kong Stock Exchange Country: Hong Kong Domestic Market Cap: $ 2,345 Billion The Hong Kong Stock Exchange is Asia’s second largest stock exchange, founded in 1891. It has 1,241 listed companies with a combined market capitalization of $2.7 trillion. In 2000, the Stock Exchange of Hong Kong Limited, Hong Kong Futures Exchange Limited together with Hong Kong Securities Clearing Company Limited merged together under a single exchange HKEx. 8. Toronto Stock Exchange Country: Canada Domestic Market Cap: $ 1,608 Billion Toronto stock exchange is the third largest stock exchange in North America and the eighth largest in the world. It was founded in 1861, and descended from the Toronto group of Brokers. It has the most oil, gas and mining companies listed on it than any other stock exchange. It trades about 250 million shares per day. 9. BM & FBovespa Country: Brazil Domestic Market Cap: $ 1,337 Billion Bolsa de Valores, Mercadorias & Futuros de São Paulo is a stock exchange based in Sao Paulo. It was established in 1890 and is the 10th largest stock exchange in the world today in terms of market capitalization. There are 450 companies listed under it. It has offices in New York, Shanghai and London. In 2008, the São Paulo Stock Exchange (Bovespa) and the Brazilian Mercantile and Futures Exchange (BM&F) merged, creating BM&FBOVESPA 10. Bombay Stock Exchange Country: India Domestic Market Cap: $ 1,306 Billion The Bombay Stock Exchange is the oldest stock exchange in Asia, and the 12th Largest in the world. It is located on Dalal Street in Mumbai. It has about 5000 companies listed on it. The BSE Sensex is widely used for trading in Asia and India. It was founded in 1875, and its trading volume is $1000 billion. It is the largest of the 22 stock exchanges in India. It has grown significantly since 1990, when liberalization and privatization gained momentum in India.
Bond Markets by Country and Region, 2001 - 2009 2009 Total in Trillions of $ U.S. % of Total: 2001 - 2009 • World: $92.1 • U.S.: $31.7 • Japan: $11.9 • EU: $33.6 • UK: $4.7 • France: $5.2 • Germany: $ 5.7 • Italy: $ 5.1 • Euro Area: $27.2 • Newly Industrialized Asia* $ 1.8 • Developing Countries: $ 7.6 * Includes: Hong Kong, Korea, Singapore and Taiwan.
Banking Markets by Country and Region, 2001 - 2009 2009 Total in Trillions of $ U.S. % of Total: 2001 - 2009 • World: $92.9 • U.S.: $14.2 • Japan: $ 8.9 • EU: $41.7 • UK: $10.7 • France: $8.8 • Germany: $ 5.1 • Italy: $ 3.4 • Euro Area: $29.1 • Newly Industrialized Asia* $ 3.6 • Developing Countries: $16.0 * Includes: Hong Kong, Korea, Singapore and Taiwan.
World’s Ten Largest Banks, 2010 1. BNP Paribas – $3.21 Trillion in Assets BNP operates in 84 countries along with retail banking markets in France, Luxembourg, Italy, and Belgium. 2. Royal Bank of Scotland Group (RBS) – $2.99 Trillion in Assets Although the British Government is currently the largest owner of RBS, it is still the largest banking group in Scotland offering personal banking, business banking, private banking, insurance, and corporate finance services. 3. Barclay’s PLC – $2.5 Trillion in Assets Barclay’s is currently listed on both the London and New York Stock Exchange and was represented on the Tokyo Stock Exchange up until 2008. They offer a variety of services ranging from wealth management to retail banking while operating under two business groups: Global Retail & Commercial Banking and Investment Banking & Investment Management. 4. Deutsche Bank – $2.43 Trillion in Assets With 2,000 Branches in 72 countries, Deutsche Bank remains the largest German bank. 5. HSBC Bank – $2.42 Trillion in Assets HSBC has 460 branches in the United state. All but 80 are located in New York State. This bank offers their services to 4 million customers giving them access to global markets. 6. Credit Agricole – $2.3 Trillion in Assets As one of the leading retail banking companies in Europe and France, Credit Agricole has 11,500 branches world wide and services about 59 million customers. 7. Bank of America (BAC) – $2.5 Trillion in Assets Bank of America is the largest bank holding company in the United States. It serves 99% of the Fortune 500 Companies along with clients all over the globe. After acquiring Merrill Lynch in 2008, BAC has become the largest wealth manager in the world. 8. Mitsubishi UFJ Financial Group (Mitsubishi) – $2.07 Trillion in Assets Mitsubishi is Japan’s largest bank holding group providing investment services such as trust banking, commercial banking, international finance and asset management services. 9. J. P. Morgan Chase – $2.02 Trillion in Assets JPM is traded on the New York Stock Exchange and provides services to clients in 100 countries. 10. UBS AG – $1.8 Trillion in Assets With Headquarters in Zurich and Basel, UBS AG offers services to private, corporate, and institutional clients holding its stance in major financial markets throughout the world.
Foreign Exchange Markets Daily Volume in Billions of USD • Total: $5,056 • United Kingdom: $1,854 • United States: $ 904 • Japan: $ 312 • Singapore: $ 266 • Switzerland: $ 263 • Hong Kong: $ 238 • Australia: $ 192