Download
1 / 15
150 likes | 281 Views
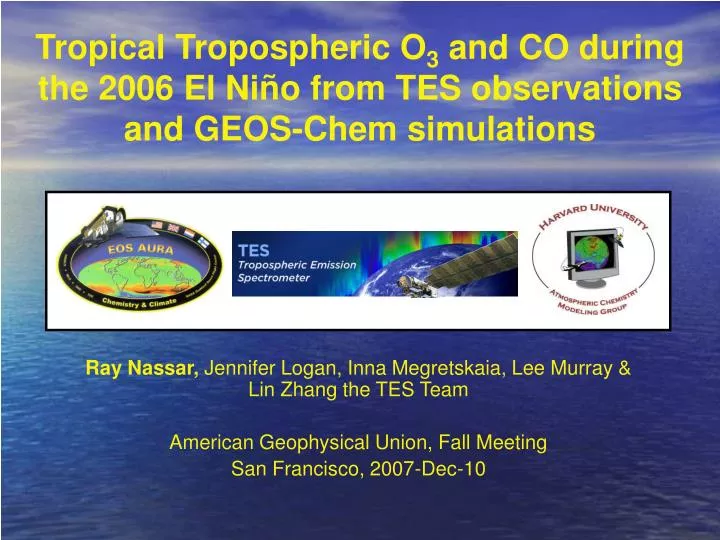
Tropical Tropospheric O 3 and CO during the 2006 El Niño from TES observations and GEOS-Chem simulations. Ray Nassar, Jennifer Logan, Inna Megretskaia, Lee Murray & Lin Zhang the TES Team American Geophysical Union, Fall Meeting San Francisco, 2007-Dec-10. El Niño. 1997 – 1996 Anomalies.

E N D
Tropical Tropospheric O3 and CO during the 2006 El Niño from TES observations and GEOS-Chem simulations Ray Nassar, Jennifer Logan, Inna Megretskaia, Lee Murray & Lin Zhang the TES Team American Geophysical Union, Fall Meeting San Francisco, 2007-Dec-10
El Niño 1997 – 1996 Anomalies Tropical Pacific SST anomaly induces changes in atmospheric convection, precipitation and composition Asymmetric Dipole Anomalies: Tropospheric ozone column residual MLS H2O at 215 hPa Outgoing Longwave Radiation O3 H2O OLR http://ggweather.com/enso/nino_regions.gif Chandra et al. (1998) GRL
Modeling O3 from the 1997 El Niño Hauglustaine, Brasseur & Levine (1999) GRL MOZART model Sudo & Takahashi (2001) GRL CHASER model Trop Column Ozone from TOMS using Convective Cloud Differential technique Chandra et al. (2002) JGR GEOS-Chem model TCO using CCD, TOMS TOMS Aerosol Index for biomass burning -> Biomass Burning component -> Meteorology/Dynamics/Convection component Duncan et al. (2003) JGR GEOS-Chem: biomass burning and lightning Observations Model Chandra et al. (2002) JGR
Tropospheric Emission Spectrometer (TES)Ozone and CO October 2006 Well-characterized O3 with ~ 2 DOFS in the troposphere Ozone TES has simultaneous coincident CO, a better proxy for biomass burning than TOMS Aerosol Index CO see: Logan et al. GRL accepted
GEOS-Chem Simulations • 3-D global tropospheric Chemical Transport Model (CTM) • Goddard Earth Observing System 4 (GEOS-4) meteorology • 10 month spin-up, 15 month run from 2005-09 to 2006-12 • 2º latitude x 2.5º longitude resolution • v7.04.10 but with improved lightning parameterization • Global Fire Emission Database 2 (GFED2) emissions TES and GEOS-Chem Comparisons • TES v02 O3 & CO filtered using data quality and O3 emission layer flags • Removed cloudy TES profiles (effOD > 2.0, cloud top above 750 hPa) • GEOS-Chem sampled at TES positions and times (Dt < 1.5 hr) • TES averaging kernel and constraint (TES op) applied to GEOS-Chem • TES averaged in 2ºx 2.5º bins to match model • TES averaged over 6 vertical levels: UT (464-287 hPa), LT (825-511 hPa)
TES & GEOS-Chem LT CO: October 2006 Differences exceed TES CO bias of 10%, Luo et al. (2007)
2006–2005 CO Differences GEOS-Chem TES Observations October November December
2006–2005 CO Differences GEOS-Chem GFED 2005 & 2006 GEOS-Chem GFED 2005 both years TES Observations October November December
TES & GEOS-Chem LT O3: October 2006 Differences exceed 3-10 ppbv bias in TES ozone Nassar et al. (2008)
2006–2005 O3 Differences GEOS-Chem GFED 2005 & 2006 GEOS-Chem GFED 2005 both years TES Observations October November December
CO and O3 Contribution due to Enhanced Biomass Burning 2006 meteorology/emissions – 2006 meteorology with 2005 emissions O3 CO October November December Note: different color scale
O3: Separating the Effects of Meteorology and Emissions 2006 - 2005 different emissions same meteorology 2006 - 2005 different meteorology same emissions = + 2006 - 2005 October November December Note: different color scale
GEOS-Chem & Lightning Imaging Sensor (LIS) LIS Observations 2006-2005 GEOS-Chem 2006 Lightning Flashrate GEOS-Chem 2006-2005 October November December Note: Flashrates below a given absolute threshold were omitted for % differences
2006–2005 O3 DifferencesLightning Tests Lightning Flashrate Increased by up to 200% Climatological Lightning Flashrate TES Observations October November December
Future Work Conclusions • GEOS-Chem tropical O3 and CO are low relative to TES in some areas • TES and GEOS-Chem both show elevated O3 and CO over Indonesia in late 2006 • October/November 2006 O3 anomalies clearly relate to increased Indonesian biomass burning during dry El Niño conditions, but also have a dynamical/convective component • Persistent December O3 anomaly possibly relates to lightning changes coupled with weaker convection both associated with the 2006 El Niño • Further ozone sensitivity tests with GEOS-Chem • Run with 8-day GFED2 emissions instead of monthly • Run without lightning to assess full lightning contribution • Run with LIS measured lightning distributions for (35ºS-35ºN)