Download
1 / 1
10 likes | 103 Views
What effect does the math redesign lab have on the students learning? What is the correlation between time duration and test scores?. Chartese Jones - MCIS Department - Mississippi Valley State University Mentor : Dr. Raymond Williams, Mississippi Valley State University. ABSTRACT

E N D
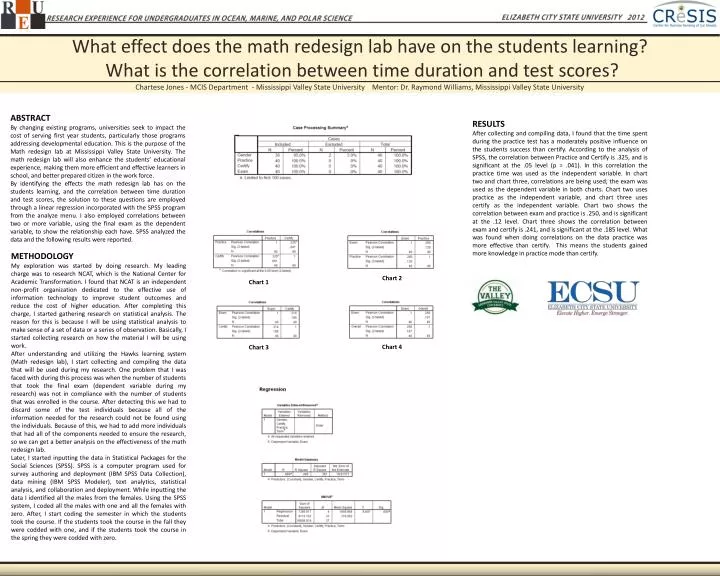
What effect does the math redesign lab have on the students learning? What is the correlation between time duration and test scores? Chartese Jones - MCIS Department - Mississippi Valley State University Mentor: Dr. Raymond Williams, Mississippi Valley State University ABSTRACT By changing existing programs, universities seek to impact the cost of serving first year students, particularly those programs addressing developmental education. This is the purpose of the Math redesign lab at Mississippi Valley State University. The math redesign lab will also enhance the students’ educational experience, making them more efficient and effective learners in school, and better prepared citizen in the work force. By identifying the effects the math redesign lab has on the students learning, and the correlation between time duration and test scores, the solution to these questions are employed through a linear regression incorporated with the SPSS program from the analyze menu. I also employed correlations between two or more variable, using the final exam as the dependent variable, to show the relationship each have. SPSS analyzed the data and the following results were reported. • RESULTS • After collecting and compiling data, I found that the time spent during the practice test has a moderately positive influence on the students success than certify. According to the analysis of SPSS, the correlation between Practice and Certify is .325, and is significant at the .05 level (p = .041). In this correlation the practice time was used as the independent variable. In chart two and chart three, correlations are being used; the exam was used as the dependent variable in both charts. Chart two uses practice as the independent variable, and chart three uses certify as the independent variable. Chart two shows the correlation between exam and practice is .250, and is significant at the .12 level. Chart three shows the correlation between exam and certify is .241, and is significant at the .185 level. What was found when doing correlations on the data practice was more effective than certify. This means the students gained more knowledge in practice mode than certify. METHODOLOGY My exploration was started by doing research. My leading charge was to research NCAT, which is the National Center for Academic Transformation. I found that NCAT is an independent non-profit organization dedicated to the effective use of information technology to improve student outcomes and reduce the cost of higher education. After completing this charge, I started gathering research on statistical analysis. The reason for this is because I will be using statistical analysis to make sense of a set of data or a series of observation. Basically, I started collecting research on how the material I will be using work. After understanding and utilizing the Hawks learning system (Math redesign lab), I start collecting and compiling the data that will be used during my research. One problem that I was faced with during this process was when the number of students that took the final exam (dependent variable during my research) was not in compliance with the number of students that was enrolled in the course. After detecting this we had to discard some of the test individuals because all of the information needed for the research could not be found using the individuals. Because of this, we had to add more individuals that had all of the components needed to ensure the research, so we can get a better analysis on the effectiveness of the math redesign lab. Later, I started inputting the data in Statistical Packages for the Social Sciences (SPSS). SPSS is a computer program used for survey authoring and deployment (IBM SPSS Data Collection), data mining (IBM SPSS Modeler), text analytics, statistical analysis, and collaboration and deployment. While inputting the data I identified all the males from the females. Using the SPSS system, I coded all the males with one and all the females with zero. After, I start coding the semester in which the students took the course. If the students took the course in the fall they were codded with one, and if the students took the course in the spring they were codded with zero. Chart 2 Chart 1 Chart 4 Chart 3