Download
1 / 7
70 likes | 218 Views
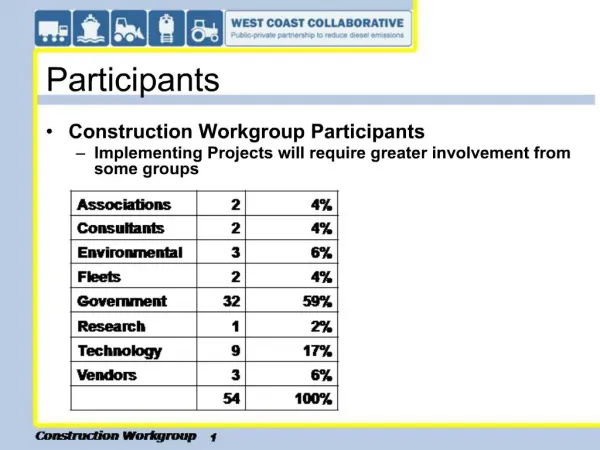
Political Participants. Wilson 7B. Reporting . Overstating participation 72% say they regularly vote 56% actually vote in presidential years Young Low-income Less-educated Non-white Day-to-day life not political Work, family, church more important. Types of Participation.

E N D
Political Participants Wilson 7B
Reporting • Overstating participation • 72% say they regularly vote • 56% actually vote in presidential years • Young • Low-income • Less-educated • Non-white • Day-to-day life not political • Work, family, church more important
Types of Participation • Verba and Nie research study • Completely inactive – no participation of any kind – 22% • Voting specialists – regularly vote but little else • Campaigners – vote and get involve in campaigns • Communalists – nonpartisan community activist with local focus • Parochial participant – don’t vote or campaign, but contact politicians • Activists – participate in all forms – 11%
Causes of Participation • More likely to vote when they have personal qualities that make learning about politics easier and more gratifying • Church-goers • Race* • Occupation • Education • Age • Not Gender
Top Reasons for Not voting • Loss of confidence in political leaders • No correlation to voting behavior • More African Americans registered • Political parties don’t mobilize as well • Impediments to registration* • Not voting has no cost • Fewer people think elections matter
Meaning of Participation Rates • Americans vote less, but participate more • Other forms becoming more common • Some forms of participation not done elsewhere • Americans elect more officials, with more elections • US turnout rates are heavily skewed to higher status persons • Automatic registration and compulsory voting rights elsewhere may end with bad results
Free Response • Non-voting has become an epidemic in the US, where only 1/3 of the electorate vote in non-presidential national elections, and as few as 10% of the electorate votes in statewide special elections. • Describe the merits of compulsory voting. • Describe the detriments to society compulsory voting might create.