Download
1 / 1
10 likes | 209 Views
Image and metadata server (Web Map Service). multi-terabyte data store (netCDF files). http://www.resc.rdg.ac.uk resc@rdg.ac.uk. Interactive Visualization of Environmental Data using Google Maps and Google Earth. Jon Blower, Dan Bretherton, Keith Haines, Chunlei Liu, Adit Santokhee

E N D
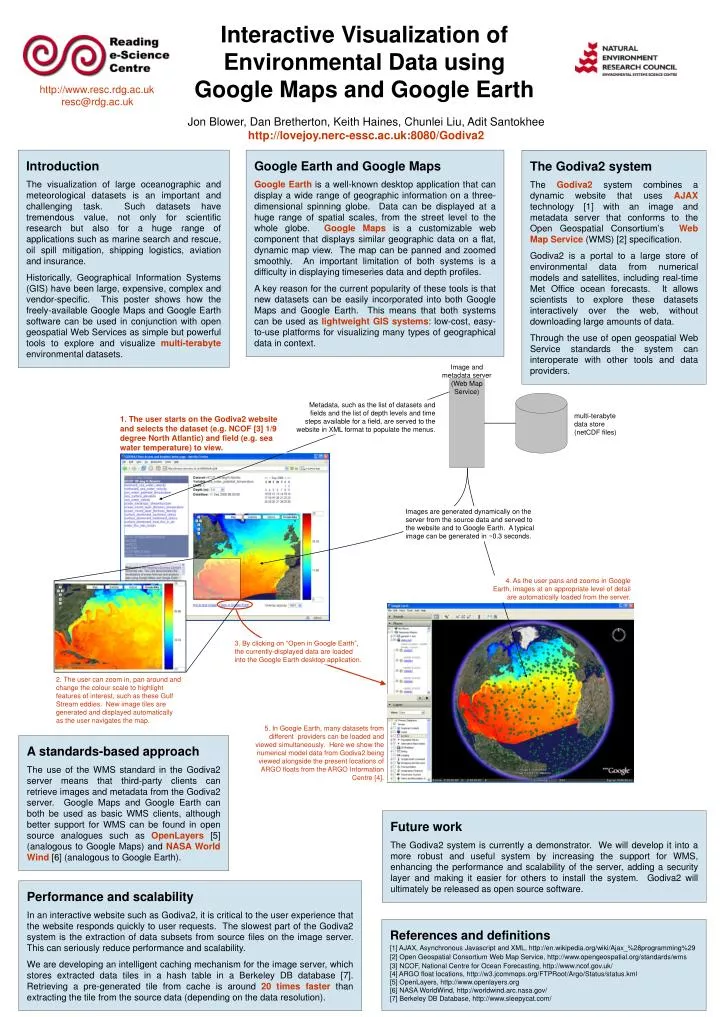
Image and metadata server (Web Map Service) multi-terabyte data store (netCDF files) http://www.resc.rdg.ac.uk resc@rdg.ac.uk Interactive Visualization of Environmental Data using Google Maps and Google Earth Jon Blower, Dan Bretherton, Keith Haines, Chunlei Liu, Adit Santokhee http://lovejoy.nerc-essc.ac.uk:8080/Godiva2 Introduction The visualization of large oceanographic and meteorological datasets is an important and challenging task. Such datasets have tremendous value, not only for scientific research but also for a huge range of applications such as marine search and rescue, oil spill mitigation, shipping logistics, aviation and insurance. Historically, Geographical Information Systems (GIS) have been large, expensive, complex and vendor-specific. This poster shows how the freely-available Google Maps and Google Earth software can be used in conjunction with open geospatial Web Services as simple but powerful tools to explore and visualize multi-terabyte environmental datasets. Google Earth and Google Maps Google Earth is a well-known desktop application that can display a wide range of geographic information on a three-dimensional spinning globe. Data can be displayed at a huge range of spatial scales, from the street level to the whole globe. Google Maps is a customizable web component that displays similar geographic data on a flat, dynamic map view. The map can be panned and zoomed smoothly. An important limitation of both systems is a difficulty in displaying timeseries data and depth profiles. A key reason for the current popularity of these tools is that new datasets can be easily incorporated into both Google Maps and Google Earth. This means that both systems can be used as lightweight GIS systems: low-cost, easy-to-use platforms for visualizing many types of geographical data in context. The Godiva2 system The Godiva2 system combines a dynamic website that uses AJAX technology [1] with an image and metadata server that conforms to the Open Geospatial Consortium’s Web Map Service (WMS) [2] specification. Godiva2 is a portal to a large store of environmental data from numerical models and satellites, including real-time Met Office ocean forecasts. It allows scientists to explore these datasets interactively over the web, without downloading large amounts of data. Through the use of open geospatial Web Service standards the system can interoperate with other tools and data providers. Metadata, such as the list of datasets and fields and the list of depth levels and time steps available for a field, are served to the website in XML format to populate the menus. 1. The user starts on the Godiva2 website and selects the dataset (e.g. NCOF [3] 1/9 degree North Atlantic) and field (e.g. sea water temperature) to view. Images are generated dynamically on the server from the source data and served to the website and to Google Earth. A typical image can be generated in ~0.3 seconds. 4. As the user pans and zooms in Google Earth, images at an appropriate level of detail are automatically loaded from the server. 3. By clicking on “Open in Google Earth”, the currently-displayed data are loaded into the Google Earth desktop application. 2. The user can zoom in, pan around and change the colour scale to highlight features of interest, such as these Gulf Stream eddies. New image tiles are generated and displayed automatically as the user navigates the map. 5. In Google Earth, many datasets from different providers can be loaded and viewed simultaneously. Here we show the numerical model data from Godiva2 being viewed alongside the present locations of ARGO floats from the ARGO Information Centre [4]. A standards-based approach The use of the WMS standard in the Godiva2 server means that third-party clients can retrieve images and metadata from the Godiva2 server. Google Maps and Google Earth can both be used as basic WMS clients, although better support for WMS can be found in open source analogues such as OpenLayers [5] (analogous to Google Maps) and NASA World Wind [6] (analogous to Google Earth). Future work The Godiva2 system is currently a demonstrator. We will develop it into a more robust and useful system by increasing the support for WMS, enhancing the performance and scalability of the server, adding a security layer and making it easier for others to install the system. Godiva2 will ultimately be released as open source software. Performance and scalability In an interactive website such as Godiva2, it is critical to the user experience that the website responds quickly to user requests. The slowest part of the Godiva2 system is the extraction of data subsets from source files on the image server. This can seriously reduce performance and scalability. We are developing an intelligent caching mechanism for the image server, which stores extracted data tiles in a hash table in a Berkeley DB database [7]. Retrieving a pre-generated tile from cache is around 20 times faster than extracting the tile from the source data (depending on the data resolution). References and definitions [1] AJAX, Asynchronous Javascript and XML, http://en.wikipedia.org/wiki/Ajax_%28programming%29 [2] Open Geospatial Consortium Web Map Service, http://www.opengeospatial.org/standards/wms [3] NCOF, National Centre for Ocean Forecasting, http://www.ncof.gov.uk/ [4] ARGO float locations, http://w3.jcommops.org/FTPRoot/Argo/Status/status.kml [5] OpenLayers, http://www.openlayers.org [6] NASA WorldWind, http://worldwind.arc.nasa.gov/ [7] Berkeley DB Database, http://www.sleepycat.com/