Download
1 / 60
610 likes | 635 Views
Explore WireVis, a visual analytical tool developed in collaboration with Bank of America for detecting financial fraud through analyzing 7 million transactions over a year. Combating human intelligence with augmented human intelligence. Discover the power of visual analytics in fraud detection.

E N D
Big Data Visual Analytics: A User Centric Approach Remco Chang Assistant Professor Tufts University
Human + Computer • Human vs. Artificial Intelligence Garry Kasparov vs. Deep Blue (1997) • Computer takes a “brute force” approach without analysis • “As for how many moves ahead a grandmaster sees,” Kasparov concludes: “Just one, the best one” • Artificial vs. Augmented Intelligence Hydra vs. Cyborgs (2005) • Grandmaster + 1 chess program > Hydra (equiv. of Deep Blue) • Amateur + 3 chess programs > Grandmaster + 1 chess program1 1. http://www.collisiondetection.net/mt/archives/2010/02/why_cyborgs_are.php
Example: What Does (Wire) Fraud Look Like? • Financial Institutions like Bank of America have legal responsibilities to report all suspicious wire transaction activities (money laundering, supporting terrorist activities, etc) • Data size: approximately 200,000 transactions per day (73 million transactions per year) • Problems: • Automated approach can only detect known patterns • Bad guys are smart: patterns are constantly changing • Data is messy: lack of international standards resulting in ambiguous data • Current methods: • 10 analysts monitoring and analyzing all transactions • Using SQL queries and spreadsheet-like interfaces • Limited time scale (2 weeks)
WireVis: Financial Fraud Analysis • In collaboration with Bank of America • Develop a visual analytical tool (WireVis) • Visualizes 7 million transactions over 1 year • Beta-deployed at WireWatch • A great problem for visual analytics: • Ill-defined problem (how does one define fraud?) • Limited or no training data (patterns keep changing) • Requires human judgment in the end (involves law enforcement agencies) • Design philosophy: “combating human intelligence requires better (augmented) human intelligence” R. Chang et al., Scalable and interactive visual analysis of financial wire transactions for fraud detection. Information Visualization,2008. R. Chang et al., Wirevis: Visualization of categorical, time-varying data from financial transactions. IEEE VAST, 2007.
WireVis: A Visual Analytics Approach Search by Example (Find Similar Accounts) Heatmap View (Accounts to Keywords Relationship) Keyword Network (Keyword Relationships) Strings and Beads (Relationships over Time)
Visual Analytics = Human + Computer • Visual analytics is “the science of analytical reasoning facilitated by visual interactive interfaces.” 1 • By design, it is a collaboration between human and computer to solve hard problems. 1. Thomas and Cook, “Illuminating the Path”, 2005.
“The computer is incredibly fast, accurate, and stupid. Man is unbelievably slow, inaccurate, and brilliant. The marriage of the two is a force beyond calculation.” -Leo Cherne, 1977 (often attributed to Albert Einstein)
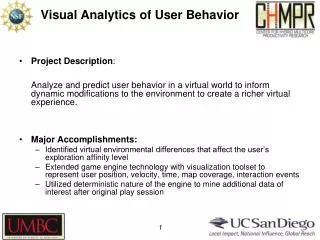
Applications of Visual Analytics • Political Simulation • Agent-based analysis • With DARPA • Global Terrorism Database • With DHS • Bridge Maintenance • With US DOT • Exploring inspection reports • Biomechanical Motion • Interactive motion comparison R. Chang et al., Two Visualization Tools for Analysis of Agent-Based Simulations in Political Science. IEEE CG&A, 2012
Applications of Visual Analytics • Political Simulation • Agent-based analysis • With DARPA • Global Terrorism Database • With DHS • Bridge Maintenance • With US DOT • Exploring inspection reports • Biomechanical Motion • Interactive motion comparison Who Where What Evidence Box Original Data When R. Chang et al., Investigative Visual Analysis of Global Terrorism, Journal of Computer Graphics Forum,2008.
Applications of Visual Analytics • Political Simulation • Agent-based analysis • With DARPA • Global Terrorism Database • With DHS • Bridge Maintenance • With US DOT • Exploring inspection reports • Biomechanical Motion • Interactive motion comparison R. Chang et al., An Interactive Visual Analytics System for Bridge Management, Journal of Computer Graphics Forum,2010. To Appear.
Applications of Visual Analytics • Political Simulation • Agent-based analysis • With DARPA • Global Terrorism Database • With DHS • Bridge Maintenance • With US DOT • Exploring inspection reports • Biomechanical Motion • Interactive motion comparison R. Chang et al., Interactive Coordinated Multiple-View Visualization of Biomechanical Motion Data, IEEE Vis (TVCG) 2009.
Future of Visual Analytics Keyboard, Mouse • Current Approach: • One command, one response (not quite a collaboration) • Assumptions: • User’s mouse and keyboard actions with a visualization reflect a user’s reasoning process • If the computer knows what the user’s reasoning process, it can better support (collaborate with) the user • Goals: • Can we extract a higher level information about the user through analyzing theuser’s interactions? • How will the computer utilize such information? Input Visualization Human Output Images (visualizations)
Extracting User Model from Interactions 1. Learning about a User in Real-Time Who is the user, and what is she doing?
Experiment: Finding Waldo • Google-Maps style interface • Left, Right, Up, Down, Zoom In, Zoom Out, Found
Pilot Visualization – Completion Time Fast completion time Slow completion time Eli Brown et al., Where’s Waldo. IEEE VAST 2014.
“Real-Time” Prediction (Limited Time Observation) State-Based Linear SVM Accuracy: ~70% Interaction Sequences N-Gram + Decision Tree Accuracy: ~80%
Predicting a User’s Personality Internal Locus of Control External Locus of Control Ottley et al., How locus of control influences compatibility with visualization style. IEEE VAST , 2011. Ottley et al., Understanding visualization by understanding individual users. IEEE CG&A, 2012.
Predicting Users’ Personality Traits • Noisy data, but can detect the users’ individual traits “Extraversion”, “Neuroticism”, and “Locus of Control” at ~60% accuracy by analyzing the user’s interactions alone. Predicting user’s “Extraversion” Linear SVM Accuracy: ~60%
User-Model Adaptive Databases 2. What Can a System Do If It Knows Something About Its User?
Problem Domain: Big Data Exploration Large Data in a Data Warehouse Visualization on a Commodity Hardware
Problem Statement • Constraint: Data is too big to fit into the memory or hard drive of the personal computer • Note: Ignoring various database technologies (OLAP, Column-Store, No-SQL, Array-Based, etc) • Goal: Guarantee a result set to a user’s query within X number of seconds. • Based on HCI research, the absolute upperbound for X is 10 seconds • Ideally, we would like to get it down to 1 second or less • In CS talk: trading speed for accuracy, but optimize on minimizing latency (user wait time).
Our Approach: Predictive Pre-Computation and Pre-Fetching • In collaboration with MIT and Brown • Models the user based on their past interaction histories • “Guesses” a set of the user’s possible next moves • pre-computes and pre-fetches the necessary data chunks • If the guesses are right, the user would experience no wait time
Interactive Visualization System client middleware Recommender Predictive Engine Recommender Recommender Cooked Tile Cache Caching and Query Execution Semi-Cooked Tile Cache database Server Server Server
Preliminary System and Evaluation • Using a simple Waldo-like interface • 18 users explored the NASA MODIS dataset • Users were in WA • Database in Boston • Tasks include “find 4 areas in Europe that have a snow coverage index above 0.5” • What happens if the guesses are “wrong”?
Wrap Up: Visual Analytics Theory and Practice • Visual analytics offers tremendous opportunities to combine “human + computer” as a collaborative computational unit • “Increasing the input bandwidth” is a critical challenge. There is a lot of “signal” about the user’s reasoning process and analysis behaviors that can be extracted from analyzing their (past) interactions. • By modeling the user based on their past interactions, we can design very complex (adaptive) systems to better support the user. The example of “big data” is just one of many potentially rich and impactful example.
Prediction Algorithms • General Idea: • Lots of “experts” who recommends chunks of data to pre-fetch / pre-compute • One “manager” who listens to the experts and chooses which experts’ advice to follow • Each “expert” gets more of their recommendations accepted if they keep guessing correctly
Iteration: 0 99 13 48 11 3 45 2 13 99 67 31 82 7 22 42
Iteration: 0 99 13 48 11 3 45 2 13 99 67 31 82 7 22 42
Iteration: 0 99 13 48 11 3 45 2 13 99 67 31 82 7 22 42 User Requests Data Block 13
Iteration: 0 99 13 48 11 3 45 2 13 99 67 31 82 7 22 42 User Requests Data Block 13
Iteration: 0 99 13 48 11 3 45 2 13 99 67 31 82 7 22 42 User Requests Data Block 13
Iteration: 1 27 4 12 34 88 34 5 23 1 92 13 42 12 31 32
Training • Instead of training the manager in real-time, this process can be done offline • Using past user interaction logs • This approach is similar to how Database are currently tuned • Instead of a DBA manually tune the performance of a database • Past SQL logs are used to automatically tune the database for an organization’s specific needs (e.g. read-mostly, write-often, etc.)
How to Determine the “Experts”? • More detail on this later • Some obvious ones include: • Momentum-based • Data similarity-based • Frequency (hot-spot)-based • Past action sequence-based • Generally speaking, given the “manager” approach, we want as many different types of “experts” as possible
Preliminary Results • Using a simple Google-maps like interface • 18 users explored the NASA MODIS dataset • Tasks include “find 4 areas in Europe that have a snow coverage index above 0.5”
Worst Case Scenario: Cache Miss 99 13 48 11 3 45 2 13 99 67 31 82 7 22 42 User’s Requests Data Block 52
Cache Miss • How to guarantee response time when there’s a cache miss? • Trick: the ‘EXPLAIN’ command • Usage: explainselect * from myTable; • Not standard SQL, but implemented in most commercial databases
Example EXPLAIN Output from SciDB • Example SciDB the output of (a query similar to) Explain SELECT * FROM earthquake [("[pPlan]: schema earthquake <datetime:datetime NULL DEFAULT null, magnitude:double NULL DEFAULT null, latitude:double NULL DEFAULT null, longitude:double NULL DEFAULT null> [x=1:6381,6381,0,y=1:6543,6543,0] bound start {1, 1} end {6381, 6543} density 1 cells 41750883 chunks 1 est_bytes 7.97442e+09 ")] The four attributes in the table ‘earthquake’ Notes that the dimensions of this array (table) is 6381x6543 This query will touch data elements from (1, 1) to (6381, 6543), totaling 41,750,833 cells Estimated size of the returned data is 7.97442e+09 bytes (~8GB)
Other Examples • Oracle 11g Release 1 (11.1)
Other Examples • MySQL 5.0
Other Examples • PostgreSQL 7.3.4
Query Modification • Based on the resulting query plan, our system chooses one of three strategies to reduce results from the query • Can be based on the literal resolution of the visualization (number of pixels) • Or desired data size
Reduction Strategies • Aggregation: • In SciDB, this operation is carried out as regrid (scale_factorX, scale_factorY) • Sampling • In SciDB, uniform sampling is carried out as bernoulli (query, percentage, randseed) • Filtering • Currently, the filtering criteria is user specified where (clause)
Quick Summary • Key Components: • Pre-computation and pre-fetching • Three-tiered system • Pre-fetching based on “expert-manager” approach • Use the “explain” trick to handle cache-miss • Guarantees response time, but not data quality