Download
1 / 54
540 likes | 549 Views
Find Genes With Small Effect. Association. Genetic Architecture. Very large number of QTLS, each of small effect Complex interactions with other genes and with the environment. QTL Detection Works in Animals. And It Replicates. F2 Analysis. Inbred Strain 1. Inbred Strain 2. F1. F2.

E N D
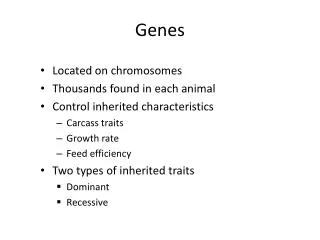
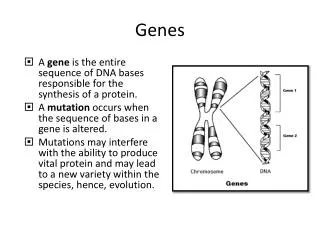
Find Genes With Small Effect • Association
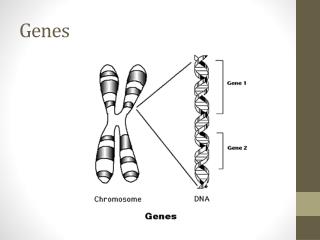
Genetic Architecture • Very large number of QTLS, each of small effect • Complex interactions with other genes and with the environment
F2 Analysis Inbred Strain 1 Inbred Strain 2 F1 F2
Map the Genes 1. Genotype a few hundred animals 2. Classify animals as heterozygote or homozygote for either allele 3. Associate genotype with phenotype (e.g. ANOVA)
Do It Yourself • Files in F:jonathaf\PhenosAndGenos.xls
Why Is It So Easy? • Simple genetics
Genetic Architecture • Small number of QTLs with relatively large effect • Genetic effect mostly additive • Little evidence for epistasis GO CLONE!
Subsequent Problems • Interpret the phenotype • Find the gene
Mapping Anxiety in Mice • A complex battery of psychological tests
Behavioural Tests • Shuttle box • Open field • Elevated plus maze • Fear conditioning • Acoustic Startle Response
QTL Cloning • Fine map the locus • Identify some candidates • Find sequence variants
Poor Resolution of QTL Detection Genetic effects are usually mapped to a region of between a quarter and a half the size of a chromosome
Step 1: Fine Mapping • Chromosome dissection • Historical recombination
One locus on chromosome 2 influencing seizure susceptibility contains at least three genes
Recombinant Inbreds F2 Brother Sister Mating Recombinant Inbred
Results of RIST C = Homozygote 1 H = Homozygote 2 C/H = Heterozygote Non Significant
Interpret the Test • Where is the QTL? • Does it make a difference if I use a different marker?
Chromosome Dissection Techniques Don’t Work • A single large QTL almost always turns out to be due to the joint effect of many smaller QTLs
Historical Recombinations F0 F1 F2 F3 F4
Increasing Generations Increases Resolution F2 F6 Sub centimorgan mapping needs about 30 generations of breeding
Genetically Heterogeneous Mice A/J AKR Balb C3H C57 DBA IS RIII HS Random Breeding HS generations >50
Association Tests in Drosophila • If a molecular marker and a site contributing to variationin a quantitative trait (QTN) are physically close to one another, they are likely tobe in linkage disequilibrium. This linkage disequilibrium willresult from the two sites only rarely recombining from one anotherand hence sharing a common evolutionary history Disequilibriumbetween the marker site and QTN can be detected as a significantregression of marker site allelic state on the phenotypic measure Use a permutation-based statisticalapproach for assessing marker/phenotype associations that isrobust with respect to the number of correlated molecular markersused Test for marker/phenotype associations ina number of different genetic backgrounds to increase the powerof detecting significant associations