Download
1 / 15
150 likes | 282 Views
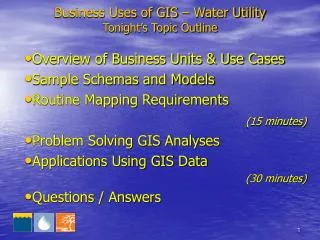
The Uses of GIS at Syngenta. Warner Phelps Ph.D., DABT Manager, Environmental Exposure Assessment. Business Mapping Market Research Customer Surveys Bulk Tanks Pest Distributions Customer Support Information. Environmental Crop Location Product Use Location Monitoring Products

E N D
The Uses of GIS at Syngenta Warner Phelps Ph.D., DABT Manager, Environmental Exposure Assessment
Business Mapping Market Research Customer Surveys Bulk Tanks Pest Distributions Customer Support Information Environmental Crop Location Product Use Location Monitoring Products Field Study Placement Understanding Product Behavior (CART analysis) Two Major Areas For GIS
Business-Mapping Market Research • Identify Market Segments Geographically • Develop Appropriate Marketing Plans & Messages • Results from Customer Surveys often have a geographic component.
Quartile Top 25% Bottom 25% Sales Volume by County
Business-Bulk Tanks • Bulk tanks at customer location. Product in tank belongs to us. Customer “buys” by removing product from tank. • Sensors on tanks report in 4x per day. • Mapping of tanks reflects, sales, weather patterns, and farmer preferences.
Pest Distributions • Pests can be weeds, insects or disease. • Mapping resistant weeds is a sales opportunity (lost or gained) • Mapping insects shows where farmers are/will have problems - can be done on field scale. • Mapping product disease problems is also important.
Customer Support Information • Internal Customer Support- Interactive Maps to Show Sales Reps for any area • Plant Disease Models- Evaluates likelihood of disease based on known contributing factors, maps the result, and can send e-mails to customers warning about conditions.
Crop and Product Use Locations • See Demo
Group 1 All sites H% > 21.1 n y Group 2 Group 3 n Latitude > 42.8256 y Group 4 Group 5 y n CEC > 19.05 Group 6 Group 7 Example CART: Variable B
Conclusions • GIS helps with “business focus” • GIS helps with Customer Support • GIS helps improve product safety