Download
1 / 33
671 likes | 2.06k Views
MEDIAN OR QUANTILES. MOHSIN TAHIR (GL) WAQAS AKRAM RAO ARSLAN M ARSLAN ALI ASGAR. CONTANTS. MEDIAN Median Examples Median from Ungrouped Data Median from Grouped Data Median from Discrete Data Quantiles Quartiles Deciles Percentiles. WORK DISTRIBUTION. Muhammad Arslan :

E N D
MEDIAN OR QUANTILES MOHSIN TAHIR (GL) WAQAS AKRAM RAO ARSLAN M ARSLAN ALI ASGAR
CONTANTS MEDIAN Median Examples Median from Ungrouped Data Median from Grouped Data Median from Discrete Data Quantiles Quartiles Deciles Percentiles
WORK DISTRIBUTION • Muhammad Arslan: What is Median? Examples Median for Ungroup Data • Rao Arslan: Median for Group Data Examples • Ali Asgar: Median for Discrete Data Examples
WORK DISTRIBUTION WaqasAkram: Quantiles Quarlites Examples Mohsintahir: Decile Persentile Examples
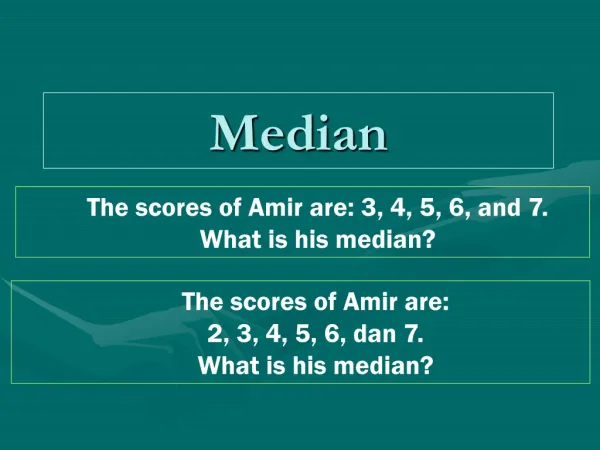
MEDIAN The midpoint of the values after they have been ordered from the smallest to the largest, or the largest to the smallest. For an even set of numbers, the median will be the arithmetic average of the two middle numbers. Median is denoted by “m”. It is the middle value of a data set,
MEDIAN • After data are ordered • If is odd median is the number • If is even median is the arithmetic average of and number
Example Compute the median for the following data. The age of a sample of five college students is: 21, 25, 19, 20, and 22. Solution: 21, 25, 19, 20, 22 Arranging the data in ascending order gives: 19, 20, 21, 22, 25 Thus the median is: 21
Example: Numbers odd Find the median of the values 4, 1, 8, 13, 11.
Example: Numbers even Find the median of the values 5, 7, 10, 20, 16, 12
Median from Grouped Data The median for grouped data, we find the cumulative frequencies and then calculated the median number . The median lies in the group (class) which corresponds to the cumulative frequency in which lies. We use following formula to find the median.
Where: = Lower class boundary of the model class. = Frequency of the median class.= Number of values or total frequency.= Cumulative frequency of the class preceding the median class.= Class interval size of the model class.
Example: Calculate median from the following data. Solution:
Median from Discrete Data When the data follows the discrete set of values grouped by size. We use the formula item for finding median. First we form a cumulative frequency distribution and median is that value which corresponds to the cumulative frequency in which item lies. Example: The following frequency distribution is classified according to the number of leaves on different branches. Calculate the median number of leaves per branch.
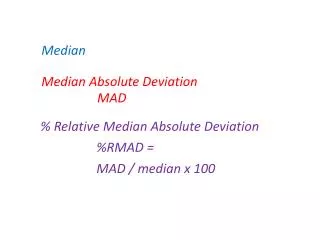
Quantiles Quartiles, deciles, percentiles and other values obtained by equal subdivision of the given set of the data, are collectively called Quantiles or sometimes Fractiles.
Quartiles There are three quartiles called, first quartile, second quartile and third quartile. There quartiles divides the set of observations into four equal parts. The second quartile is equal to the median. The first quartile is also called lower quartile and is denoted by Q1. The third quartile is also called upper quartile and is denoted by Q3. The lower quartile Q1 is a point which has 25% observations less than it and 75% observations are above it. The upper quartile Q3 is a point with 75% observations below it and 25% observations above it.
Quartile for Individual Observations (Ungrouped Data) Quartile for Grouped Frequency Distribution
Example: The wheat production (in Kg) of 20 acres is given as: 1120, 1240, 1320, 1040, 1080, 1200, 1440, 1360, 1680, 1730, 1785, 1342, 1960, 1880, 1755, 1720, 1600, 1470, 1750, and 1885. Find the quartile deviation and coefficient of quartile deviation.
Solution: After arranging the observations in ascending order, we get1040, 1080, 1120, 1200, 1240, 1320, 1342, 1360, 1440, 1470, 1600, 1680, 1720, 1730, 1750, 1755, 1785, 1880, 1885, 1960.
Example: Calculate the quartile deviation and coefficient of quartile deviation from the data given below:
Deciles • The deciles are the partition values which divides the set of observations into ten equal parts. • The nine values which divide the distribution into ten equal parts, are called deciles. They are denoted by D1 , D2 ….. D9. Deciles for Individual Observations (Ungrouped Data)
Quartile for Grouped Frequency Distribution: Examples: compute the 5thdecile from the given data: 26,22,14,30,18,11,35,41,12,32
After arranging the observations in ascending order. we get 11,12,14,18,22,26,30,32,35,41 n=10 D5= value of th item =value of th item = value of (5.5)th item. =5th item + 0.5 (6th item – 5th item) = 22 + 0.5 (26 - 22) = 22 + 2 = 24
Example: Find the 5thdecile from the following observation. Solution:
Percentiles • The ninety nine values dividing the data into one hundred equal parts are called percentiles. They are denoted by P1 , P2 …….. P99. • The percentiles are usually calculated for grouped data. • The first percentile denoted by P1is calculated as. • We find the group in which the itemlies and then is interpolated from the formula.
Example: Find the 5thdecile from the following observation. Solution: