Download
1 / 30
320 likes | 547 Views
Sequence Analysis. Hemant Kelkar Center for Bioinformatics University of North Carolina Chapel Hill, NC 27599. Scope of Series. Talk I Overview and BLAST Talk II Protein analysis/Sequence Alignment Talk III Evolution Genomics and challenges. Bioinformatics.

E N D
Sequence Analysis Hemant Kelkar Center for Bioinformatics University of North Carolina Chapel Hill, NC 27599
Scope of Series Talk I • Overview and BLAST Talk II • Protein analysis/Sequence Alignment Talk III • Evolution • Genomics and challenges
Bioinformatics • Mathematical, Statistical and computational methods that are used for solving biological problems • Glue that holds the “omics” data together
Help … • Is “my sequence” in the databases? • Is it similar to any sequence in the DB? • Does it have any know motifs/domains that can help in identification? • Is there a structural homolog? • Are there any polymorphisms? • Genetic Map location? Bioinformatics TOOLS!
Bioinformatics Tools • Genetic Code • Similarity search e.g. BLAST, FASTA • Protein Structure • http://restools.sdsc.edu/biotools/biotools9.html • Protein Evolution • e.g. CLUSTALW, T-COFFEE, Phylip
Primary Sequence Databases • GenBank (http://www.ncbi.nlm.nih.gov/Genbank/index.html) • PIR (http://pir.georgetown.edu/) • Swiss-Prot (http://us.expasy.org/sprot/) Sequence information as is generated in the laboratory
Derived Sequence Databases Databases based on functional or phylogenetic analysis • PFAM (http://www.sanger.ac.uk/Software/Pfam/) : Protein families based on HMM models • InterPRO (http://www.ebi.ac.uk/interpro/) : Protein families and domains based on functional sites • TransFac (http://www.gene-regulation.com/) transcription factor db • Cytochrome P450 database (http://drnelson.utmem.edu/CytochromeP450.html)
Derived Sequence Databases Databases based on taxonomy • Flybase (http://www.flybase.org/) : Fly Genome • Wormbase (http://www.wormbase.org/) : C. elegans • Genome Browser (http://genome.ucsc.edu/) : Human and Mouse • MGI (http://www.informatics.jax.org/) : Mouse • Microbial Genome Resource : (http://www.tigr.org/tigr-scripts/CMR2/CMRHomePage.spl)
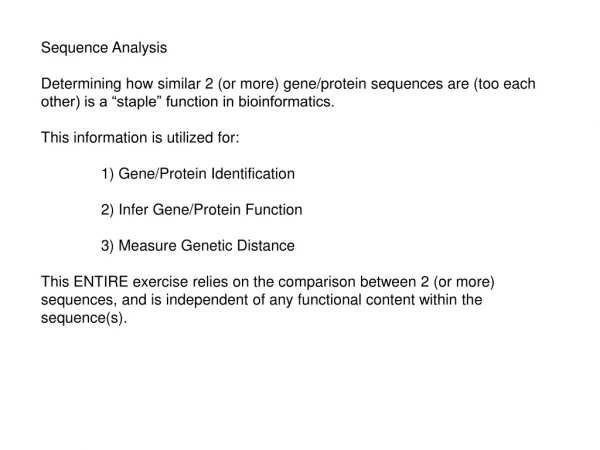
Sequence Alignments • Provide a measure of relation between the nucleotide or protein sequence • This allows us to decipher: • Structural relationships • Functional relationships • Evolutionary relationships
Sequence Similarity Searches • Information conserved evolutionarily • DNA sequences NOT coding for proteins/rRNAs diverge rapidly • When possible use protein sequences for similarity searches • Non-homologous protein identification is much less reliable • What is measured and what is inferred?
Similarity • Is always based on an observable • Usually expressed as % identity • Quantifies the divergence of two sequences • substitutions/insertions/deletions • Residues crucial for structure and/or function
Homology • Homology always implies that the molecules share a common ancestor • Absolute answer • Molecules ARE or ARE NOT homologous • No degrees
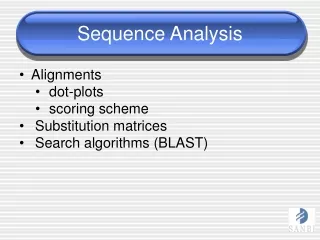
How to Find Similar Sequences • Global Sequence Alignments • Sequence comparison along entire length • Homolog of similar length • Local Sequence Alignments • Similar regions in two sequences • Regions outside the local alignment excluded • Sequences of different length/similarity
Scoring Matrices • Empirical weighting schemes • Considers important biology • Side chain chemistry/structure/function • Functional/Structural Conservation • Ile/Val – small and hydrophobic • Ser/Thr – both polar • Size/Charge/Hydrophibicity
Nucleotide Matrix A C G T A 5 -4 -4 -4 C -4 5 -4 -4 G -4 -4 5 -4 T -4 -4 -4 5
PAM Scoring Matrices • Margaret Dayhoff (1978) • Point accepted mutations (PAM) • Patterns of substitutions in highly related proteins (>85% identical), based on multiple sequence alignments • New side chains must function similarly • 1 PAM 1 AA change per 100 AA • 1 PAM ~ 1 % Divergence
BLOSUM Matrices • Henikoff and Henikoff (1992) • Blocks Substitution Matrices • Differences in conserved ungapped regions • Directly calculated no extrapolations • Sensitive to structural/functional subs • Generally perform better for local similarity searches
BLOSUM n • Calculated from sequences sharing no more than n% identity • Sequences with more than n% identity are clustered and weighted to 1 • Reducing the value of “n” yields more divergent/distantly-related sequences • BLOSUM62 used as default by many of the online search sites
Matrices and more PAM Matrices (Altschul, 1991) PAM 40 Short alignments >70% PAM120 >50% PAM250 Longer weaker local areas >30% BLOSUM Matrices (Henikoff, 1993) BLOSUM 90 Short alignments >60% BLOSUM 80 >50% BLOSUM 62 Commonly used >35% BLOSUM 30 Longer, weaker local alignments
Gaps • Compensate for insertion and deletions • Improvement alignments • Must be kept to a reasonably small number • 1 per 20 residues is logical • Need a different scoring scheme
Gap Penalties • Penalty for gap introduction • Penalty for Gap extension Deductions for Gap = G + Ln Nuc Prot where G = gap-opening penalty 5 11 L = Gap-extension penalty 2 1 n = Length of gap
BLAST • Basic Local Alignment Search Tool • Seeks high-scoring segment pair (HSP) • Sequences that can be aligned w/o gaps • have a maximal aggregate score • score be above score threshold S • Many HSP reported for ungapped blast
BLAST Algorithms Program Query Target BLASTN Nucloetide Nucleotide BLASTP Protein Protein BLASTX Nucleotide Protein (6-Frame) TBLASTN Protein Nucleotide (6FR) TBLASTX Nucloetide(6FR) Nucloetide(6FR)
STL 13 SAL 8 SNL 8 SVL 8 SBL 7 SCL 7 SDL 7 Etc. = 4 + 5 + 4 Neighborhood Words Query Word (W = 3) Query: SISPGQRVGLLGRTGSGKSTLLSAFLRMLN-IKGDIE Neighborhood Score Threshold (T = 8)
Query: SISPGQRVGLLGRTGSGKSTLLSAFLRMLN-IKGDIE ++ G + ++G G+GKS+LLSA L L+ ++G + Sbjct: TVPQGCLLAVVGPVGAGKSSLLSALLGELSKVEGFVS High-Scoring Segment Pairs STL 13 SAL 8 SNL 8 SVL 8 SBL 7 SCL 7 SDL 7 Etc.
X Cumulative Score S T Query: SISPGQRVGLLGRTGSGKSTLLSAFLRMLN-IKGDIE Extension ++ G + ++G G+GKS+LLSA L L+ ++G + Sbjct: TVPQGCLLAVVGPVGAGKSSLLSALLGELSKVEGFVS Extension • Significance Decay • Mismatches • Gap penalties
Karlin Altschul Equation E = kmNe-λs m Number of letters in query N Number of letters in db mN Size of search space λs Normalized score k minor constant